COVID - 19 Prevalence in Tennessee by County
Load Data
Load Data
The data source for this is the Tennessee department of health. The source of the data about Tennessee counties is the curated data from Wolfram Research.
In[]:=
tnData=Import["https://www.tn.gov/content/dam/tn/health/documents/cedep/novel-coronavirus/datasets/Public-Dataset-County-New.XLSX",{"Dataset",1},HeaderLines1];
Set up the mapping between the counties that are on the TN Department of Health to the entities that are used to the entities that Wolfram understands. This is because the TN dataset has “Dekalb” while Wolfram has the correct “DeKalb”.
In[]:=
Processing
Processing
Exclude the data that is marked as “Pending” or “Out of State” since this doesn’t work well in the context of county-specific processing. At this stage we also add the additional property of PopulationPercentTotal which is the ratio of the people that have tested positive for COVID-19 over the population of each county.
In[]:=
augTnData=tnData[Select[KeyExistsQ[countyMap,#COUNTY]&],<|#,"PopulationPercentTotal"If[#"TOTAL_CASES"≠"",#"TOTAL_CASES"/QuantityMagnitude[countyMap[#COUNTY][EntityProperty["AdministrativeDivision","Population"]]],0]|>&];
Next we group the data by county. From here out we deal with counties in isolation.
In[]:=
countyData=KeySortBy[augTnData[GroupBy["COUNTY"]],-countyMap[#][EntityProperty["AdministrativeDivision","Population"]]&];
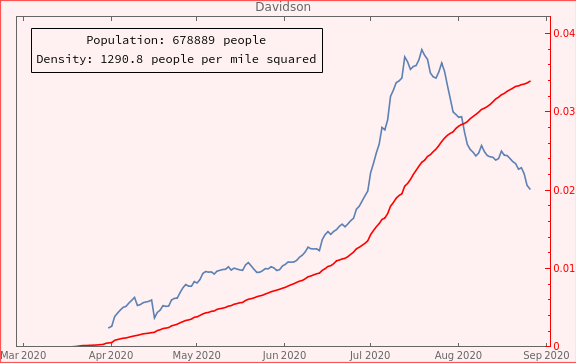
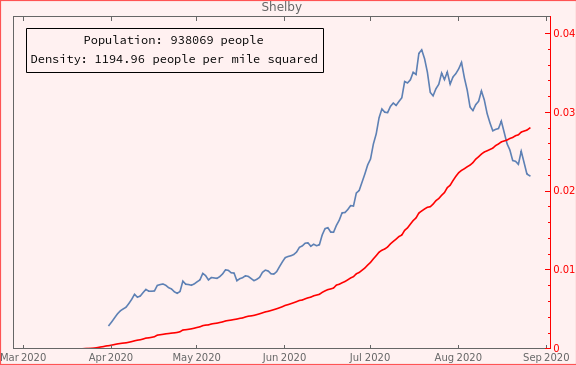
Finally create a graph of the data from each of the county’s dataset. We are plotting two different values that bear some correlation: the total number of active cases in the county as well as the percentage of the population of people who have tested positive in that county over time. Note that the total positive percentage can only effectively go up.
In[]:=
countyCallout[c_]:=TemplateApply[StringTemplate["Population: `pop`\nDensity: `dens`",<|"pop"->c[EntityProperty["AdministrativeDivision","Population"]],"dens"->c[EntityProperty["AdministrativeDivision","PopulationDensity"]]|>]]
In[]:=
countyGraphs=Legended[DateListPlot[Legended[TimeSeries[Normal[{#DATE,#"TOTAL_ACTIVE"}&/@#]],"Active Cases"],PlotRange{Automatic,{0,All}},AxesLabelAutomatic],DateListPlot[Legended[TimeSeries[Normal[{#DATE,#PopulationPercentTotal}&/@#]],"% pop ever pos"],PlotStyleRed,FrameStyleRed,PlotRange{Automatic,{0,.04}}],"AxesSides""TwoY",PlotLabelPosition[countyData,#][[1]][[1]][[1]],ImageSizeLarge],Placed[Framed[countyCallout[countyMap[Position[countyData,#][[1]][[1]][[1]]]]],{0.3,0.9}]&/@countyData[1;;2]
Out[]=
Samples of some of the bigger counties
In[]:=
countyGraphs["Davidson"]
Out[]=
In[]:=
countyGraphs["Shelby"]
Out[]=
Final exports
Final exports
In[]:=
Export["covid19/00-Davidson.png",Show[countyGraphs["Davidson"],ImageSizeLarge]]
Out[]=
covid19/00-Davidson.png
In[]:=
Scan[Export["covid19/"<>IntegerString[Flatten[Position[Keys[countyGraphs],#]][[1]],10,2]<>"-"<>#<>".png",countyGraphs[#]]&,Keys[countyGraphs]]
Work area
Work area
In[]:=
countyData["Davidson"]
Out[]=