WOLFRAM NOTEBOOK

Analysis of the Corona Virus

Seth J. Chandler 2020

Get the data from the Google Sheet

In[]:=
sharingURL="https://docs.google.com/spreadsheets/d/1kUSYR3eqWHLzmWoxl69NrwEX_zwPf_GFM6_5DAiB-MI/edit?usp=sharing";
Now use StringReplace to replace the material after the final “/” with "export?format=csv".
In[]:=
urlCSV=StringReplace[sharingURL,"edit?usp=sharing"->"export?format=csv"]
Out[]=
https://docs.google.com/spreadsheets/d/1kUSYR3eqWHLzmWoxl69NrwEX_zwPf_GFM6_5DAiB-MI/export?format=csv
Change the URL to tell the Google Sheet to export itself as csv
And, now, I can import it as an CSV object. Note that we get both sheets of the spreadsheet.
In[]:=
corona=Import[urlCSV,"Dataset",HeaderLines1]
Out[]=
Year
Month
Day
TotalCases
NewTotalCases
ChinaTotalCases
ChinaSuspectedCases
NewChinaTotalCases
ChinaSevereCases
NewChinaSevereCases
ChinaDeaths
NewChinaDeaths
OutsideChinaTotalCases
OutsideChinaNewCases
Countries
OutsideChinaDeaths
WHOChinaRisk
WHORegionalRisk
WHOGlobalRisk
2020
1
20
282
278
60
51
6
4
2020
1
21
314
32
309
51
6
4
3
2020
1
23
581
267
571
95
17
4
Very High
High
High
2020
1
24
846
265
830
259
177
25
11
Very High
High
High
2020
1
25
1320
474
1297
1965
237
41
23
9
Very High
High
High
2020
1
26
2014
694
1985
324
56
29
10
Very High
High
High
2020
1
27
2798
2741
5794
461
80
37
11
Very High
High
High
2020
1
28
4593
4537
6973
976
106
56
14
Very High
High
High
2020
1
29
6065
5997
9239
1239
132
68
15
Very High
High
High
2020
1
30
7818
7736
12167
1370
170
82
18
Very High
High
High
2020
1
31
9826
9720
15238
1527
213
106
19
Very High
High
High
2020
2
1
11963
2128
11821
2102
1795
268
259
46
132
26
23
Very High
High
High
2020
2
2
14557
2504
14111
2590
2110
315
304
45
146
14
23
1
Very High
High
High
2020
2
3
17391
2838
17238
2831
2296
186
361
57
153
7
23
1
Very High
High
High

Convert the chronological information into Wolfram Language date objects

In[]:=
corona2=Query[All,Association["date"DateObject[{#Year,#Month,#Day}],#]&][corona]
Out[]=
date
Year
Month
Day
TotalCases
NewTotalCases
ChinaTotalCases
ChinaSuspectedCases
NewChinaTotalCases
ChinaSevereCases
NewChinaSevereCases
ChinaDeaths
NewChinaDeaths
OutsideChinaTotalCases
OutsideChinaNewCases
Countries
OutsideChinaDeaths
WHOChinaRisk
WHORegionalRisk
WHOGlobalRisk
Mon 20 Jan 2020
2020
1
20
282
278
60
51
6
4
Tue 21 Jan 2020
2020
1
21
314
32
309
51
6
4
3
Thu 23 Jan 2020
2020
1
23
581
267
571
95
17
4
Very High
High
High
Fri 24 Jan 2020
2020
1
24
846
265
830
259
177
25
11
Very High
High
High
Sat 25 Jan 2020
2020
1
25
1320
474
1297
1965
237
41
23
9
Very High
High
High
Sun 26 Jan 2020
2020
1
26
2014
694
1985
324
56
29
10
Very High
High
High
Mon 27 Jan 2020
2020
1
27
2798
2741
5794
461
80
37
11
Very High
High
High
Tue 28 Jan 2020
2020
1
28
4593
4537
6973
976
106
56
14
Very High
High
High
Wed 29 Jan 2020
2020
1
29
6065
5997
9239
1239
132
68
15
Very High
High
High
Thu 30 Jan 2020
2020
1
30
7818
7736
12167
1370
170
82
18
Very High
High
High
Fri 31 Jan 2020
2020
1
31
9826
9720
15238
1527
213
106
19
Very High
High
High
Sat 1 Feb 2020
2020
2
1
11963
2128
11821
2102
1795
268
259
46
132
26
23
Very High
High
High
Sun 2 Feb 2020
2020
2
2
14557
2504
14111
2590
2110
315
304
45
146
14
23
1
Very High
High
High
Mon 3 Feb 2020
2020
2
3
17391
2838
17238
2831
2296
186
361
57
153
7
23
1
Very High
High
High

Make some quick plots

In[]:=
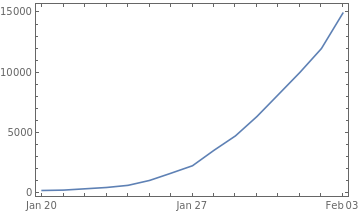
Query[DateListPlot,{#date,#ChinaTotalCases}&][corona2]
Out[]=
In[]:=
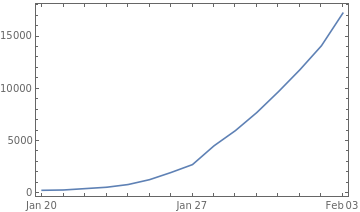
Query[DateListPlot,{#date,#OutsideChinaTotalCases}&][corona2]
Out[]=
In[]:=
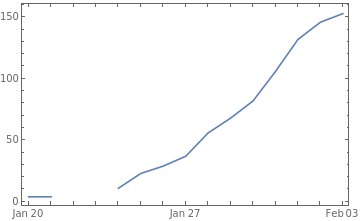
Query[DateListPlot,{#date,#ChinaSevereCases}&][corona2]
Out[]=
In[]:=
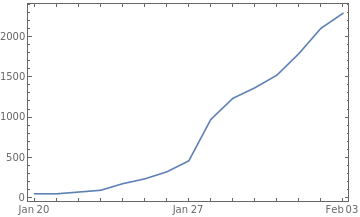
Query[DateListPlot,{#date,#ChinaTotalCases-#ChinaSevereCases}&][corona2]
Out[]=
Wolfram Cloud

You are using a browser not supported by the Wolfram Cloud

Supported browsers include recent versions of Chrome, Edge, Firefox and Safari.


I understand and wish to continue anyway »

You are using a browser not supported by the Wolfram Cloud. Supported browsers include recent versions of Chrome, Edge, Firefox and Safari.