(Local) In[]:=
gT_samp=10^(-2);(*samplingperiod*)
(Local) In[]:=
g_f0=10;(*frequency*)
(Local) In[]:=
u[t_]=Exp[I*2Pi*g_f0*t];(*continuoustimeinputwave*)
(Local) In[]:=
v[t_]=Integrate[u[τ],{τ,0,t}](*idealintegralwave*)
(Local) Out[]=
-
(-1+)
20πt
20π
(Local) In[]:=
x_dd[n_]=gT_samp*(1-Exp[I*2Pi*g_f0*gT_samp*n])/(1-Exp[I*2Pi*g_f0*gT_samp])(*integrateddiscretesignalbyEulermethod*)
(Local) Out[]=
1-
nπ
5
1001-
π
5
(Local) In[]:=
x_d[t_]:=x_dd[Floor[t/gT_samp]](*continuous-timeextensionofx_d*)
(Local) In[]:=
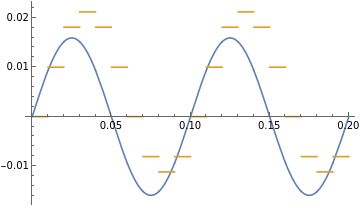
Plot[{Re[v[t]],Re[x_d[t]]},{t,0,2/g_f0},PlotLegends->"Expressions"]
(Local) Out[]=
(Local) In[]:=
gN=200;gT_int=gN*gT_samp;(*integrationtime*)
(Local) In[]:=
V[f_]=Integrate[v[t]*Exp[-I*2Pi*f*t],{t,0,gT_int}]/gT_int
(Local) Out[]=
1-
-4fπ
2(40f-4)
2
π
2
f
2
π
(Local) In[]:=
AbsArg[Limit[V[f],f->g_f0]]
(Local) Out[]=
,-
1
20π
π
2
(Local) In[]:=
N[%]
(Local) Out[]=
{0.0159155,-1.5708}
(Local) In[]:=
X_d[f_]=(1-Exp[-I*2Pi*f*gT_samp])/(1-Exp[I*2Pi*g_f0*gT_samp])/(I*2Pi*f)/gN*((1-Exp[-I*2Pi*f*gT_samp*gN])/(1-Exp[-I*2Pi*f*gT_samp])-(1-Exp[-I*2Pi*(f-g_f0)*gT_samp*gN])/(1-Exp[-I*2Pi*(f-g_f0)*gT_samp]))(*equalstoIntegrate[y[t]*Exp[-I*2Pi*f*t],{t,0,gT_int}]/gT_int*)
(Local) Out[]=
-
1--+
-fπ
1
50
1-
-4(-10+f)π
1-
-(-10+f)π
1
50
1-
-4fπ
1-
-fπ
1
50
4001-fπ
π
5
(Local) In[]:=
N[AbsArg[Limit[X_d[f],f->g_f0]]]
(Local) Out[]=
{0.0159155,-2.19911}
(Local) In[]:=
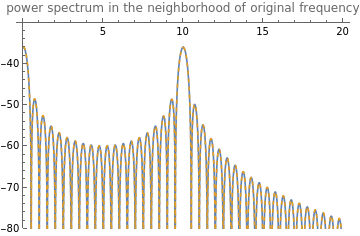
Plot[{20Log10[Abs[V[f]]],20Log10[Abs[X_d[f]]]},{f,0,2g_f0},PlotRange->{-80,-30},PlotStyle->{Normal,Dashed},PlotLegends->"Expressions",PlotLabel->"power spectrum in the neighborhood of original frequency"]
(Local) Out[]=
(Local) In[]:=
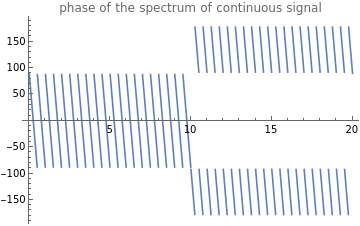
Plot[Arg[V[f]]*180/Pi,{f,0,2g_f0},PlotRangeFull,PlotLabel"phase of the spectrum of continuous signal"]
(Local) Out[]=
(Local) In[]:=
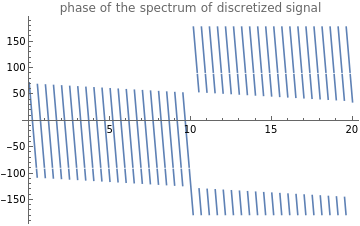
Plot[Arg[X_d[f]]*180/Pi,{f,0,2g_f0},PlotRangeFull,PlotLabel"phase of the spectrum of discretized signal"]
(Local) Out[]=
(Local) In[]:=
Arg[X_d[10.001]]*180/Pi(*phasedifferencenearg_f*)
(Local) Out[]=
-126.362
(Local) In[]:=
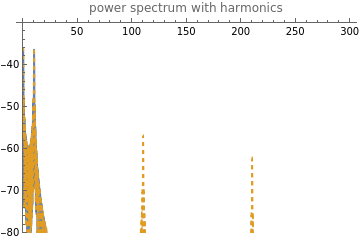
Plot[{20Log10[Abs[V[f]]],20Log10[Abs[X_d[f]]]},{f,0,3/gT_samp},PlotRange->{-80,-30},PlotStyle->{Normal,Dashed},PlotLegends->"Expressions",PlotLabel->"power spectrum with harmonics"]
(Local) Out[]=
