P-x-y and T-x-y Diagrams for Vapor-Liquid Equilibrium (VLE)
P-x-y and T-x-y Diagrams for Vapor-Liquid Equilibrium (VLE)


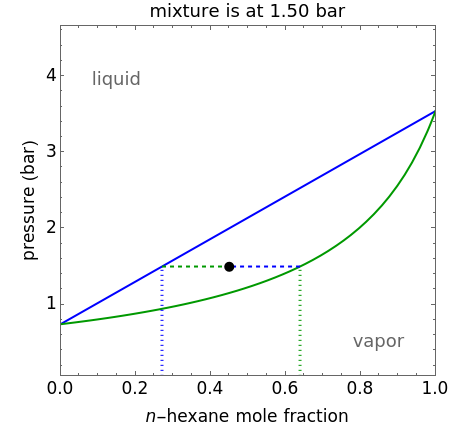
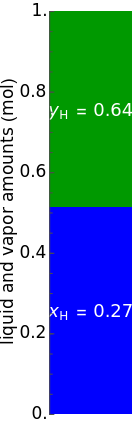
The vapor-liquid equilibrium (VLE) behavior of an -hexane/-octane mixture is demonstrated in and diagrams. The blue line represents the liquid-phase boundary (bubble point) and the green line represents the vapor-phase boundary (dew point). Click and drag the black dot on either diagram and the bar chart shows the amounts of liquid (blue) and vapor (green) present; the system contains a total of 1 mol. The mole fractions of -hexane in each phase ( for liquid phase, for vapor phase) are also shown in the bar graph. Use sliders to vary the temperature for the diagram or the pressure for the diagram. This system is modeled by Raoult's law because an -hexane/-octane liquid phase is assumed ideal.
n
n
P-x-y
T-x-y
n
x
H
y
H
P-x-y
T-x-y
n
n
Details
Details
The saturation pressure of component is calculated using the Antoine equation:
i=(1,2)
sat
P
i
A
i
B
i
T+
C
i
10
where for -hexane and for -octane, is saturation pressure (bar), , , and are Antoine constants, and is temperature (°C).
i=1
n
i=2
n
sat
P
i
A
i
B
i
C
i
T
Raoult's law is used to calculate the bubble-point and dew-point pressures using the factors:
K
K
i
y
i
x
i
sat
P
i
P
where is the vapor mole fraction and +=1, is the liquid mole fraction and +=1, and is the total pressure (bar).
y
i
y
1
y
2
x
i
x
1
x
2
P
The bubble-point pressure is calculated using :
∑=1
K
i
x
i
P=+
x
1
sat
P
1
x
2
sat
P
2
The dew-point pressure is calculated using :
∑/=1
y
i
K
i
P=+
-1
y
1
sat
P
1
y
2
sat
P
2
A screencast video at[2] shows how to use this Demonstration.
References
References
[1] J. R. Elliott and C. T. Lira, Introductory Chemical Engineering Thermodynamics, New York: Prentice Hall, 2012 pp. 372–377.
[2] P-x-y and T-x-y Diagrams for Vapor-Liquid Equilibrium (VLE). http://www.learncheme.com/simulations/thermodynamics/thermo-2/p-x-y-and-t-x-y-diagrams-for-vapor-liquid-equilibrium-vle.
External Links
External Links
Permanent Citation
Permanent Citation
Rachael L. Baumann, John L. Falconer, Megan Maguire, Nick Bongiardina
"P-x-y and T-x-y Diagrams for Vapor-Liquid Equilibrium (VLE)"
http://demonstrations.wolfram.com/PXYAndTXYDiagramsForVaporLiquidEquilibriumVLE/
Wolfram Demonstrations Project
Published: June 5, 2014