WOLFRAM NOTEBOOK

Parisi Equations Demo

TODO
- Work out the 1-RSB estimate for the Parisi equations
- Plot the objective functions
- Create a second notebook that plots like RS, 1-RSB, 2-RSB, full-RSB estimates to demo the Parisi equations.
Let’s see how the Parisi equations breakdown into their constituent parts. The time is a bit backwards but I think that’s okay...
In[]:=
xMin=-10;
In[]:=
xMax=10;
In[]:=
initCond=u[0,x]Log[2*Cosh[x]];

Heat Equations

We’ll start with the heat diffusion term in the Parisi equations.
In[]:=
pdeHeat=D[u[t,x],t]10*D[u[t,x],{x,2}];
Let’s solve it numerically
In[]:=
solHeat=NDSolve[{pdeHeat,initCond},u,{t,0,1},{x,xMin,xMax}];
NDSolve
:Warning: an insufficient number of boundary conditions have been specified for the direction of independent variable x. Artificial boundary effects may be present in the solution.
And plot a 3-D plot of the solution
In[]:=
Plot3D[Evaluate[u[t,x]/.solHeat],{t,0,1},{x,xMin,xMax},PlotRangeAll]
Out[]=
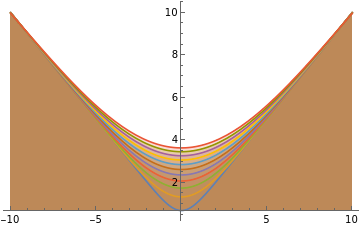
Let’s also superimpose some level sets at different time-steps.
In[]:=
dataTableHeat=Evaluate[Table[u[t,x]/.solHeat,{t,0,1,0.1}]];
In[]:=
Plot[dataTableHeat,{x,xMin,xMax},PlotRangeAll,FillingAxis]
Out[]=
The heat equations alone also give the replica symmetric estimate. The value of this estimate is given by
In[]:=
u[1,0]/.solHeat
Out[]=
{3.6403}

Gradient Descent

Let’s try the other part of the PDE where you decay as the norm of your gradient. That is “u_t = - (u_x)^2” Note that this equation has a prefactor of 2, vs. the 10 in all the other sections.
In[]:=
pdeGrad=D[u[t,x],t]2(D[u[t,x],x])^2;
and solve the equations numerically again
solGrad=NDSolve[{pdeGrad,initCond},u,{t,0,1},{x,xMin,xMax},MaxStepSize0.0001,MaxSteps->10000];
NDSolve
:Warning: an insufficient number of boundary conditions have been specified for the direction of independent variable x. Artificial boundary effects may be present in the solution.
NDSolve
:Maximum number of 10000 steps reached at the point t == 0.999919.
NDSolve
:Warning: scaled local spatial error estimate of 10.9565 at t = 0.999919 in the direction of independent variable x is much greater than the prescribed error tolerance. Grid spacing with 10000 points may be too large to achieve the desired accuracy or precision. A singularity may have formed or a smaller grid spacing can be specified using the MaxStepSize or MinPoints method options.
Let’s plot the results
In[]:=
Plot3D[Evaluate[u[t,x]/.solGrad],{t,0,1},{x,xMin,xMax},PlotRangeAll]
Out[]=
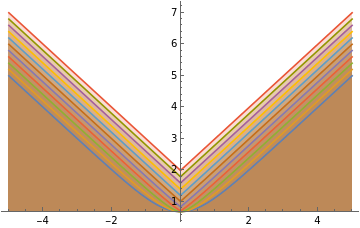
And do a superimposted plot of levelsets
In[]:=
dataTableGrad=Evaluate[Table[u[t,x]/.solGrad,{t,0,1,0.1}]];
In[]:=
Plot[dataTableGrad,{x,0.5*xMin,0.5*xMax},PlotRangeAll,FillingAxis]
InterpolatingFunction
:Input value {1.,-4.9998} lies outside the range of data in the interpolating function. Extrapolation will be used.
InterpolatingFunction
:Input value {1.,-4.9998} lies outside the range of data in the interpolating function. Extrapolation will be used.
InterpolatingFunction
:Input value {1.,-4.9998} lies outside the range of data in the interpolating function. Extrapolation will be used.
General
:Further output of InterpolatingFunction::dmval will be suppressed during this calculation.
Out[]=

Putting it all together

Okay now we put it all together to see what happens.
In[]:=
pde=D[u[t,x],t]10*(D[u[t,x],{x,2}]+(D[u[t,x],x])^2);
In[]:=
sol=NDSolve[{pde,initCond},u,{t,0,1},{x,xMin,xMax}];
NDSolve
:Warning: an insufficient number of boundary conditions have been specified for the direction of independent variable x. Artificial boundary effects may be present in the solution.
Plotting things
In[]:=
Plot3D[Evaluate[u[t,x]/.sol],{t,0,1},{x,xMin,xMax},PlotRangeAll]
Out[]=
In[]:=
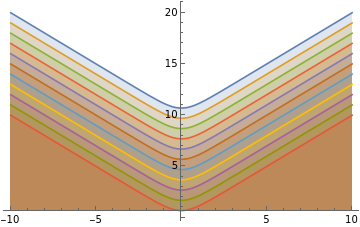
dataTable=Evaluate[Table[u[t,x]/.sol,{t,1,0,-0.1}]];
In[]:=
Plot[dataTable,{x,xMin,xMax},PlotRangeAll,FillingAxis]
Out[]=
Let’s spot check the value at the x=0 when t=1
In[]:=
u[1,0]/.sol
Out[]=
{10.6934}

Overlap given by the Gaussian CDF

What happens when we plot the Parisi equations with a non-trivial overlap CDF controlling the tradeoff between heat diffusion and gradient descent?
In[]:=
overlap1[t_]:=CDF[NormalDistribution[0.5,0.01],t];
In[]:=
Plot[overlap1[t],{t,-0.5,1.5}]
Out[]=
-0.5
0.5
1.0
1.5
0.2
0.4
0.6
0.8
1.0
We then solve the PDE with the overlap distribution
Let’s plot this and see what happens...
What’s the value at x=0 when t=1?

Convex Combination of Step Functions

Let’s try a convex combination of smooth step functions
The Parisi equations again
Plotting again
And finally the value of the solution achieved at x=0, t=1

The 1-RSB estimate

So actually... I should use the replica calculations to figure out what the 1-RSB choice of mu should be and just plot that.
Wolfram Cloud

You are using a browser not supported by the Wolfram Cloud

Supported browsers include recent versions of Chrome, Edge, Firefox and Safari.


I understand and wish to continue anyway »

You are using a browser not supported by the Wolfram Cloud. Supported browsers include recent versions of Chrome, Edge, Firefox and Safari.