Wolfram Notebooks for GIS Coursework
Wolfram Notebooks for GIS Coursework
Wolfram Technology Conference - 2024
Phileas Dazeley-Gaist - Wolfram Research
Phileas Dazeley-Gaist - Wolfram Research
What is this talk about?
We will discuss:
Managing and Representing Geographical Data in WL
Extending WL GIS Functionality Through External Services
Extending WL GIS Functionality Using Built-in WL Tools
Acknowledgements
This presentation is the result of a collaboration with Gordon Longsworth, Director of the College of the Atlantic GIS Lab.
Gordon’s insights into GIS education were of great help during the preparation for this talk.
Managing and Representing
Geographical Data in WL
Geographical Data in WL
Geospatial Data in the Wolfram Knowledgebase
Geospatial Data in the Wolfram Knowledgebase
The Wolfram Knowledgebase is a large collection of data about the real world curated by Wolfram and built-into the Wolfram Language. You can read more about it at the following link:
Wolfram Language has access to many built-in curated geographic data sources and computable geographic entities. Let’s take deeper look at them.
Entities and Entity Discovery
Entities and Entity Discovery
What are WL named entities?
What are WL named entities?
Entities in WL represent named things that the language knows about, and can perform computations with. Type “ctrl+=” to start discovering entities:
In[]:=
=[France]
Out[]=
For example:
,,,,,;
Entity classes
Entity classes
Some entities are grouped in entity classes, for example:
,,;
Use EntityList to list the entities in a class:
In[]:=
EntityList
Out[]=
,,,,,,,,,,,,,,,,,,,,,,,,,,
Entities can also represent non-geographic things, like people, plants, animals, etc.
,,;
Getting information about entities:
Getting information about entities:
To get information about an entity, we can ask for one of its properties, like so:
Get the Area property of the Mount Desert Island entity:
In[]:=
Out[]=
To get the full list of properties for an entity, you can use the “Properties” property.
Get the list of properties of the Mount Desert Island Entity:
In[]:=
Out[]=
,,,,,,,,,,,,,,,,,,,
We can also ask for all the entity information as a dataset:
What does WL know about Bar Harbor?
In[]:=
Using entities in functions
Using entities in functions
I said earlier that entities are computable. What this means is that you can use entities or data from entities in functions, and WL will try to interpret the information sensibly.
We’ll see more examples of using entities with geographic functions a little later.
For now, here’s just one example:
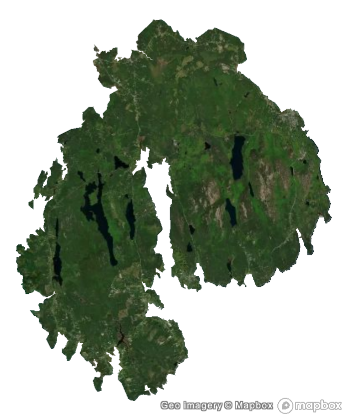
Make a satellite view cutout of MDI with a blank background:
In[]:=
GeoGraphicsGeoStyling["Satellite"],GeoPolygon,GeoBackground->None
Out[]=
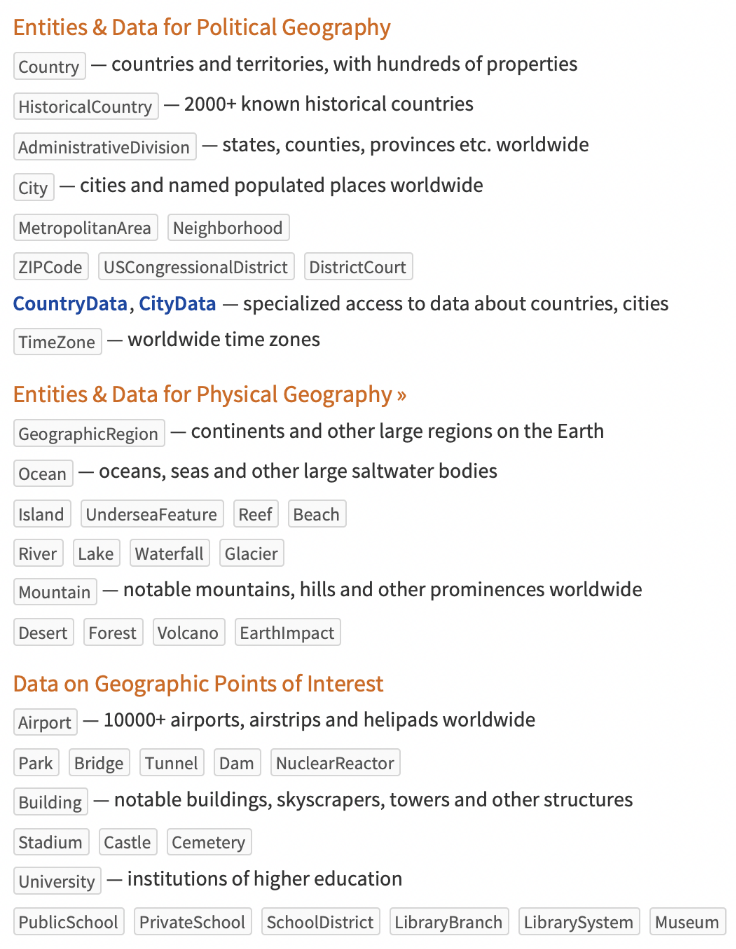
An overview of geographic entities:
An overview of geographic entities:
The following list is from the :
Curated Spatial Data
Curated Spatial Data
WL also offers a collection of curated spatial data functions. Here are just a few:
Let’s look at some of these functions in action.
GeoElevationData
GeoElevationData
Get a Digital Elevation Model (DEM) of MDI:
Make a relief plot of the DEM:
Make a contour map of the DEM:
WindVectorData
WindVectorData
Make a grid of 64 equally spaced positions covering Maine:
Sample wind vectors from yesterday in Maine using weather station data:
Preview a random sample of three vectors:
Plot the sampled vectors using GeoStreamPlot
EarthquakeData
EarthquakeData
Find magnitude 6 to 9 earthquakes around the world recorded in the last year:
Show these earthquakes on a map:
WL Geospatial Data Representations and Functions
WL Geospatial Data Representations and Functions
Representing Geospatial Data
Representing Geospatial Data
WL offers many tools with which to represent and process geographic data. These representations can all be exported to many standard GIS data formats like SHP, GeoJSON, KML, etc.
GeoPosition and GeoGridPosition
GeoPosition and GeoGridPosition
Geographic (geodetic) positions in WL are represented using the GeoPosition function. For example:
Show Null Island on a map:
Sometimes, we might like to use coordinates in other coordinate reference systems. We can do this with GeoGridPosition:
Represent a position in Albers projection coordinates:
Convert this position to a geodetic position:
Lines, Polygons, and other geospatial geometric objects
Lines, Polygons, and other geospatial geometric objects
We can also represent lines, polygons, and other shapes geographically.
Lines are just lists of points, and polygons are just lists of points that are drawn as filled shapes.
Let’s demonstrate:
Let’s demonstrate:
Choose a few random cities around the world:
Trace lines between these cities in the order given by the list:
Note that because we used geographic entities, we never had to deal with the geodetic coordinates directly. If we had wanted to, we could have extracted the coordinates like so:
Retrieve the geodetic positions of the cities:
However, for polygons, city entities are ambiguous: If I ask for the polygon of a list of cities, am I asking for a shape made of the outline of all the cities, or am I asking for a polygon with each city as a point? For this reason, we have to use the city positions directly in this case.
Trace polygons joining these cities in the order given by the list:
Using the same polygons, represent the “opposite side” of the world:
Hemispheres, Day and night hemispheres, and the day-night terminator:
Hemispheres, Day and night hemispheres, and the day-night terminator:
Represent the half of the Earth that you are at the center of:
Represent the boundary between this half of the Earth, and the other:
Represent the half of the Earth that where it is currently day:
Represent the half of the Earth where it is currently night:
Represent the current day-night terminator (the line between day and night):
Geospatial Functions
Geospatial Functions
Visualisation Functions
Visualisation Functions
General geographic plotting:
GeoGraphics can be used for all kinds of geographic plotting.
Make a map of Europe country flags:
It’s the most flexible geographic visualisation function in WL, but depending on your visualisation goals, it’s still often nicer to use others.
Single values at locations:
To plot a list of locations, you can use GeoListPlot:
Plot the list of cities defined in the last section (Representing Geospatial Data):
To plot scalar values at a list of locations, you might also use GeoBubbleChart, or GeoRegionValuePlot
Make a geographic bubble chart of the countries in Asia by population:
Make a map of African countries colored by their population size:
Contour plot and heat maps:
WL also supports geographic contour and density plotting using GeoContourPlot and GeoDensityPlot.
Import a DEM of using GeoElevationData
Plot a contour map of the Manicouagan Reservoir DEM:
Plot a heat map of the Manicouagan Reservoir DEM:
Histograms:
WL has two built-in functions for geographic histogram plotting: GeoSmoothHistogram, and GeoHistogram.
Plot a smooth spatial histogram of earthquake data:
Plot a hexagonal bin spatial histogram of earthquake data:
Stream and Vector plots:
WL also has two built-in functions for plotting flows and vector fields on maps: GeoVectorPlot, and GeoStreamPlot.
Use GeoStreamPlot to plot streamlines for wind directions in Maine:
Use GeoVectorPlot to plot vectors for wind directions in Maine:
Graph Plots:
Finally, WL has two functions for geographic network plotting: GeoGraphPlot (for unweighted graphs) and GeoGraphValuePlot (for weighted graphs).
Make a list of connections between a selection of European capital cities and Rome:
Illustrate the saying: “All roads lead to Rome” with a map of driving directions from a selection of European Capitals to Rome:
Load some flight data for flights that left the Chicago O’Hare airport Yesterday, and :
Plot the top 10 most popular airport destinations from Chicago yesterday:
Geographic Calculations
Geographic Calculations
TravelDirections: Get travel directions
Get travel directions between the five largest Brazilian cities by population:
Plot the journey:
Get the travel directions as a dataset:
GeoAntipode: Find the position on the opposite side of the Earth from a location.
Where would you need to go to make an MIT-World sandwich?
FindGeoLocation: Search locations by street address. (Forward geocoding)
Search for the MIT campus from its address:
GeoIdentify: Find matching geographic entities of a requested type given a location. (Inverse Geocoding)
Find the MIT entity from its position:
GeoNearest: Find locations that are nearest to a reference location.
Find the 10 nearest Colleges/Universities/Higher education institutions to MIT:
RandomGeoPosition: Get random geographic positions in a region
Get and plot a map of 100 random positions in Arches National Park:
This is just a sample of the built-in functions in WL for geographic computation. There’s also: GeoDistance, GeoLenth, GeoArea TravelDistance, TravelTime... And more!
Extending WL GIS Functionality
Through External Services:
Through External Services:
Base Maps from XYZ GeoServers
Base Maps from XYZ GeoServers
Demonstration: external GeoServers in Geo functions
Demonstration: external GeoServers in Geo functions
Make an association of XYZ GeoServer endpoints:
List availaable USGS base maps:
Interacting with the Mapbox API
Interacting with the Mapbox API
Implementation and Demonstration: mapboxForwardGeocoding
Implementation and Demonstration: mapboxForwardGeocoding
Mapbox Forward Geocoding:
Example:
Demonstration: mapboxIsochrone
Demonstration: mapboxIsochrone
Find the polygon showing what’s within a 15-minutes walk of Ray and Maria Stata Center at MIT:
Accessing NASA GIBS Remote Sensing Data
Accessing NASA GIBS Remote Sensing Data
Import the RemoteSensing paclet (paclets are packages with built-in documentation):
List available GIBS layers:
Make an animation of MODIS Aqua L3 NDVI imagery of France for the last 12 months:
Extending WL GIS Functionality
Using Built-in Tools
Using Built-in Tools
Hill Shading
Hill Shading
Setting up: getting a raster DEM:
Setting up: getting a raster DEM:
Define a digital elevation model (DEM) using GeoElevationData:
Preview the data:
Computing the hill shade of the DEM:
Computing the hill shade of the DEM:
Let’s define a function to compute the hill shade from a DEM:
Implementation: ShadedRelief
Implementation: ShadedRelief
Define a function to compute the hill shade of a DEM:
ShadedRelief Implementation Properties
ShadedRelief Implementation Properties
In this implementation:
By default, the sun is assumed to be directly north, at a 45° angle from the center of the DEM.
The region represented by the DEM is assumed correspond to a flat plane, with the sun infinitely far away such that light beams are parallel.
Azimuth values are interpreted modulo 360°, such that:
North (N): 0° = 360°
East (E): 90°
South (S): 180°
West (W): 270°
AltitudeAngle values are expected to be between 0 and 90°.
Basic Examples
Basic Examples
Apply the ShadedRelief function to our DEM:
Make an interactive hill shade preview using Manipulate:
Applications and Neat Examples
Applications and Neat Examples
Load sun positions data from sunrise to sunset:
Animate the change in sunlight over a region using real sun position data:
Apply a hill shade as a texture on 3d plot of the DEM:
Estimating Landscape Self-Similarity
Estimating Landscape Self-Similarity
Big picture:
With technical jargon: The degree to which the slope of the 1D power spectrum of an image matches -2 is a good estimate of the image self-similarity.
We can think of self-similarity as roughness, or fractalness.
Equipped with this knowledge, we can make a tool to measure the fractalness of images.
Implementation: radialDistanceImage, image1DPowerSpectrumData, and imageSelfSimilarity
Implementation: radialDistanceImage, image1DPowerSpectrumData, and imageSelfSimilarity
Image Self-Similarity Basic Example:
Image Self-Similarity Basic Example:
The closer this value is to 0, the more self-similar the image.
Local Landscape Self-Similarity Estimation Using Satellite Imagery
Local Landscape Self-Similarity Estimation Using Satellite Imagery
Fetch some satellite imagery:
Partition the image:
Apply imageSelfSimilarity to the partitioned image:
Plot local patch self-similarity of the landscape a different scales:
Learning resources for GIS in WL
For WL GIS Detailed Guides, the following pages are great starters:
For a quick introductory course to WL for beginners, check out An Elementary Introduction to the Wolfram Language.
For a quick introductory course to WL for programmers, check out the Wolfram Language Fast Introduction for Programmers.
For more specialised courses, check out Wolfram U
Stylesheet Customisation
Stylesheet Customisation


