Chemical Informatics
Chemical Informatics
Out[]=
Molecular shape analysis (MSA) is a vital first step in quantitative structure-activity relationships (QSAR) investigations.
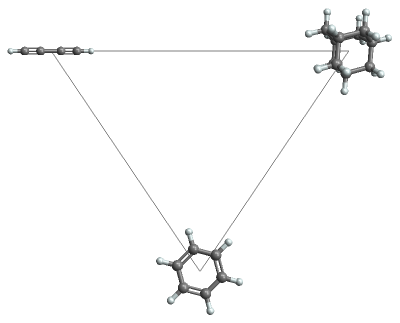
Let's classify molecular shapes using the principal moments of inertia (PMI) and visualize the results using a PMI plot.
Consider three molecules with different shapes:
In[]:=
{rod,disk,sphere}={Molecule["Buta-1,3-diyne"],Molecule["benzene"],Molecule["adamantane"]};Row[Map[MoleculePlot3D[#,ImageSize->Small]&,{rod,disk,sphere}],Spacer[10]]
Out[]=
Compute 3D coordinates for the molecules and find the principal moments of inertia:
MoleculeValue[{rod,disk,sphere},"PrincipalMoments"]
Out[]=
,,,,,,,,
Normalize the principal moments by dividing the two smaller moments by the largest moment:
MoleculeValue[{rod,disk,sphere},"NormalizedPrincipalMomentRatios"]
Out[]=
{{4.33507×,1.},{0.499999,0.500001},{0.999999,1.}}
-14
10
Now use these normalized principal moment ratios (NPRs) as the coordinates in a 2D scatter plot:
insets=Map[Inset[MoleculePlot3D[#],#["NormalizedPrincipalMomentRatios"],Center,.3]&,{rod,disk,sphere}];triangle={FaceForm@None,EdgeForm[Gray],Triangle[{{0,1},{1/2,1/2},{1,1}}]};background=Graphics[{triangle,insets},ImagePadding45,AspectRatio3/4,ImageSize400]
Out[]=
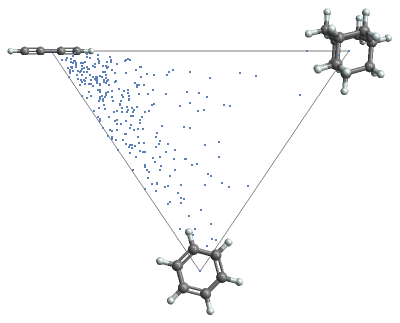
Compare the shape for a collection of molecules, using the principal moment ratios for coordinates and 3D plots for tooltips:
In[]:=
mols=;ResourceFunction["MoleculePrincipalMomentPlot"][mols]
Out[]=
Out[]=


