Lab 2: Wi Fi and Cellular
Lab 2: Wi Fi and Cellular
NetID: <Please fill in>
Part 1: Attenuation
Part 1: Attenuation
In this part, we will visualize the message signal, and see how the received signal changes with the change in distance of the receiver from the transmitter.
Visualize a signal
Visualize a signal
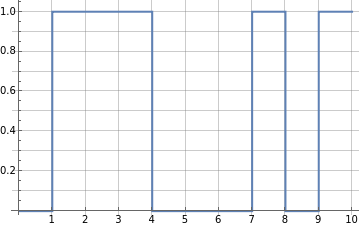
Let's start by plotting your favorite binary message (containing only ten bits).
Specify the bits:
In[]:=
bits={0,1,1,1,0,0,0,1,0,1}
Out[]=
{0,1,1,1,0,0,0,1,0,1}
Plot the signal:
In[]:=
ListStepPlotbits,
Out[]=
Visualize the location of a device and the strength of the signal it receives
Visualize the location of a device and the strength of the signal it receives
Let's say we have a WiFi router that needs to send a signal and a phone that needs to receive it.
Specify the bits in the message signal:
In[]:=
messageBits={1,0,0,1,1,0,1,0,1,1}
Out[]=
{1,0,0,1,1,0,1,0,1,1}
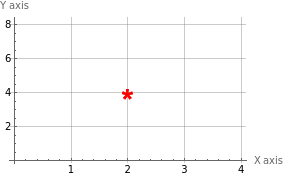
To specify location we will use the Cartesian Co-ordinate system where location of a point can be specified by x and y values, plotted along the x and y axis.So a point at {2,4} is visualized as:
Specify the locations (provide x and y values) for the router and the phone:
In[]:=
routerLocation={0.,0.}
Out[]=
{0.,0.}
In[]:=
phoneLocation={2,0}
Out[]=
{2,0}
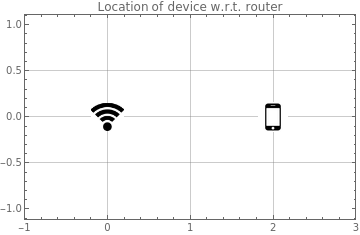
Visualize the location of the phone with respect to the router:
In[]:=
ListPlot{{routerLocation},{phoneLocation}},
Out[]=
Once you have the location of two points, it is very easy to calculate the distance between them. Thankfully we have computational tools to do this and you do not have to do the math by hand.
Calculate the distance between the router and the phone (r):
In[]:=
r=EuclideanDistance[routerLocation,phoneLocation]
Out[]=
2.
Remember signal strength reduces according to the formula So if we know the transmitted signal strength, we can compute the received signal strength.
s
2
r
Set a value for the transmitted signal strength (s):
In[]:=
s=10
Out[]=
10
Compute the received signal strength (rs):
In[]:=
rs=s/r^2
Out[]=
2.5
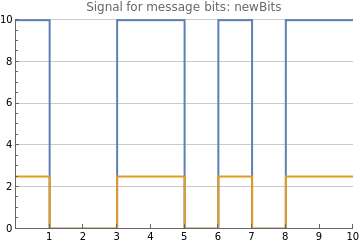
Visualize the transmitted signal at the router and the received signal at the phone together:
In[]:=
ListStepPlot{messageBits*s,messageBits*rs},
Out[]=
Change the location of the device and see what happens
Change the location of the device and see what happens
Change the location of the phone (), in the code below, to move the phone further away from or closer to the router location.
Re-evaluate the code to see how strength of the received signal changes.
phoneLocation
Re-evaluate the code to see how strength of the received signal changes.
In[]:=
messageBits={1,0,0,1,1,0,1,0,1,1}routerLocation={0.,0.}(*Makesureyouprovidean{x,y}locationforthephone*)phoneLocation={3,1}r=EuclideanDistance[routerLocation,phoneLocation]s=10rs=s/r^2ListStepPlot{messageBits*s,messageBits*rs},
Out[]=
{1,0,0,1,1,0,1,0,1,1}
Out[]=
{0.,0.}
Out[]=
{3,1}
Out[]=
3.16228
Out[]=
10
Part 2: Noise
Part 2: Noise
As we discussed in the lecture, in the real world, the received signal will contain quite a bit of noise.
Add noise to the signal
Add noise to the signal
Let’s generate some random noise and add it to the attenuated signal received by the device, i.e. the phone in our example.
Specify the message bits:
Take a look at what the signal seems to look like:
Instead of calculating the distance between the router and the phone from their respective locations, let's directly set the distance between the two.
Set the distance between the router and the phone:
Compute the strength of the attenuated at distance r:
Generate some random noise and add it to the attenuated signal:
Visualize the received signal with the effects of attenuation and noise combined:
Problem 1
Problem 1
1) Can you still decode the signal manually?
2) Try changing the distance between the router and phone (r) and report at what distance does the received signal start to get corrupted?
2) Try changing the distance between the router and phone (r) and report at what distance does the received signal start to get corrupted?
Answer:
Answer:
Making the computer decode the signal
Making the computer decode the signal
Now, let’s see if a computer can decode the signal. We will compute the average value of the signal received, for the duration of time it took to transmit one bit. Then we can plot this averaged signal along with the received signal.
Compute the average signal from the noisy signal:
Let's use a threshold for decoding the averaged signal. If the average signal strength is above the threshold, we will decode is as a 1. If the signal strength is less than or equal to the threshold, we will decode it as a 0.
Set the threshold value:
Decode the averaged received signal:
Visualize transmitted signal, noisy attenuated received signal, averaged received signal and the final decoded signal:
Problem 2
Problem 2
Using this averaging technique, do you think a computer will be able to decode the signal?
Answer
Answer
Problem 3
Problem 3
Let's try to simulate a scenario where the averaging technique may fail.
Evaluate the following code (note - the only difference from the code above is in the value of r):
Evaluate the following code (note - the only difference from the code above is in the value of r):
Now visualize the different signals:
Answer the following questions based on what you observe:
1
.What is the decoded signal?
2
.What is the maximum distance of your device from the transmitter (router or cell tower) for which the decoding works?
3
.When the decoding fails for the given threshold and the maximum distance, how would you change the threshold for decoding the signal as 1s and 0s?
4
.Alternately, would you be able to solve the issue by changing the strength of the signal you are transmitting? If yes, how would you change it?
5
.Which is the better option in your opinion (changing the threshold or changing the transmitted signal strength)?
Answer
Answer
Part 3: Interference
Part 3: Interference
Visualize interfering signals
Visualize interfering signals
Next, we will observe the effect of interference on the received signal.
First let's decide what your router is going to transmit and where it is located.
First let's decide what your router is going to transmit and where it is located.
Set the signal your router is transmitting:
Set the location of your WiFi router:
Now let's assume there are a couple of other neighboring WiFi routers around. Let's set some signals they are transmitting and locations of those routers.
Set location and signal coming from router "neighbor1":
Set location and signal coming from router "neighbor2":
We will assume all three routers are transmitting at the same signal strength.
Set the signal strength:
You will need to know how far your device is from each of the routers. So let's set the location of your device and let the computer calculate the distance of the device from each router.
Set the location of your device:
It is much easier when you can see where things are located with respect to each other.
Visualize the location of the routers and your device:
What do the signals arriving simultaneously at the device from the three different routers (i.e. with collision happening) look like? (We will ignore random noise to keep things simple).
Compute the signal strength for the signals received from each of the three routers, at your device:
Use the computed signal strengths
to see what the received signal bits look like along with noise:
to see what the received signal bits look like along with noise:
Problem 4
Problem 4
Try changing the location of the device and see how the signal graphs change.
Try one or both of the following options so that a neighbor's signal becomes stronger than the signal from your own router at your device.
(1) Change the location (coordinates {x, y)} ) for your device.
(2) Change the strength of the transmitted signal.
Report the location of your device and the strength of the transmitted signal.
Answer
Answer
Part 4: The Big Picture
Part 4: The Big Picture
Calculate SINR
Calculate SINR
Set the signal strength:
Set the strength of the noise signal:
Set the strength of the interference (all interfering signals put together):
Compute the SINR:
Visualize SINR around a router
Visualize SINR around a router
We will use some built-in tools available in Wolfram Language to visualize the SINR in two-dimension around your router, in the presence of interference from two neighboring routers.
Set the location of your router:
Set locations of two neighboring routers sending out interference:
Evaluate the following code to visualize the SINR in the area surrounding your router:
Problem 5 (Extra Credit)
Problem 5 (Extra Credit)
Try moving changing the location of your router and the neighbors’ routers to see how the coverage area changes.
Make it so that the coverage area shows an interesting configuration, and save your notebook with that configuration.
Make it so that the coverage area shows an interesting configuration, and save your notebook with that configuration.
Answer
Answer


