Lab 9: Computer Vision and NLP
Lab 9: Computer Vision and NLP
NetID: <Please fill in>
Note: Please do not rush to evaluate all code by hitting shift+enter. If you do not understand the logical progression of how we are attempting to solve the task, chances are you will run into more frustrating errors.
Part 1: Basic Image Processing Operations
In this part, we will have a look at a couple of simple examples of image processing for computer vision.
Run each line of code in the examples below and observe their effects on the image inputs.
Run each line of code in the examples below and observe their effects on the image inputs.
DominantColors
DominantColors
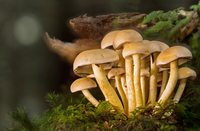
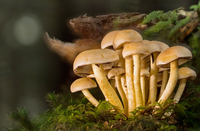
The function DominantColors returns the dominant colors in an .
image
In[]:=
DominantColors
You can also separate an image into the regions of its dominant colors, using the same function but with a few additional options:
In[]:=
DominantColors
,Automatic,{"CoverageImage","Color"}
ColorQuantize
ColorQuantize
The function ColorQuantize recreates an image but with only a few distinct colors instead of all the different shades of different colors in the original image. The number provided as the second input to the function (after the image) gives the number of colors to be used in the output image:
In[]:=
ColorQuantize
,3
In[]:=
ColorQuantize
,5
It is also possible to ColorQuantize to a few specific colors:
In[]:=
ColorQuantize
,{Black,Purple,Green}
In[]:=
ColorQuantize
,{Red,Yellow,Magenta}
Binarize
Binarize
The function Binarize creates a binary image: every pixel above a threshold value is converted to 1 or white and every pixel below the threshold is converted to 0 or white.
In[]:=
Binarize
Binarize is like ColorQuantize only using black and white:
In[]:=
ColorQuantize
,{Black,White}
Try this fun example:
In[]:=
BinarizeGradientFilter
,1,Method{"BlackFraction",.8}
EdgeDetect
EdgeDetect
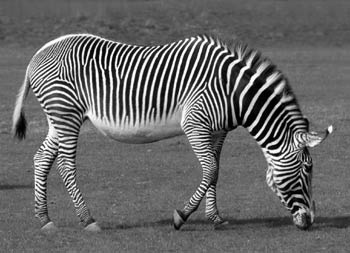
Remember the “vertical edge filter” from class. Let's apply it to an image using image convolution:
In[]:=
ImageConvolve
,
-1 | 0 | 1 |
-2 | 0 | 2 |
-1 | 0 | 1 |
We can also directly use the built-in function EdgeDetect. It includes some other processing as well as the basic edge detection filter. So it seems to do a better job of finding edges in and returns the result as a binary image.
image
In[]:=
EdgeDetect
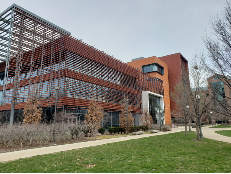
Try another example:
In[]:=
EdgeDetect
Combining Operations
Combining Operations
It is possible to apply multiple image processing operations on a single input:
In[]:=
EdgeDetectBinarize
You can also do arithmetic operations with the image output, like addition or subtraction:
In[]:=
ColorQuantize
-EdgeDetect
Problem 1
Problem 1
Use an image of your own choice and apply any two of the four image processing operations you have learned above, to create an interesting output.
Part 2: What does the Machine See?
In this part, you will experiment with the input to a model that has been trained to identify the content of an image. Can you fool the model?
Step 1
Step 1
This website has many images of animals: https://www.pexels.com/search/animal/
Pick one and use it as input below to check what the image recognition machine learning model says about this image. I have used the image of a hedgehog:
Pick one and use it as input below to check what the image recognition machine learning model says about this image. I have used the image of a hedgehog:
Step 2
Step 2
If the image changes in certain ways, the recognition algorithm is not always able to identify it correctly. One way to change the image is to Blur it a little bit or a lot.
You can control the amount of blurring by providing a number after the image. This blurs the image by averaging the pixel values over an area with the radius equal to the number provided.
Step 3
Step 3
Now try to identify the blurred image. ImageIdentify may or may not get it right.
Problem 2
Problem 2
ImageIdentify seems to work correctly on the following image:
You can blur the image by adding a pixel radius as follows:
Keep increasing the pixel radius for blurring till the point when ImageIdentify is no longer able to identify the image correctly.
1) What is the value of the pixel radius when ImageIdentify fails?
2) What does ImageIdentify say about the image as at this point?
1) What is the value of the pixel radius when ImageIdentify fails?
2) What does ImageIdentify say about the image as at this point?
Part 3: Pop art with Image Processing
In this section we will create some pop art with image processing algorithms-- specifically algorithms that help with segmenting images.
Step 1
Step 1
Find any image you like for this problem (you can use an image from the web).
Here is an example:
Here is an example:
Step 2
Step 2
The ClusteringComponents function finds clusters of pixels in an image that have similar colors. You can provide the number of clusters you want in the image. The code below will find only 3 clusters, which may not produce a very interesting result.
You might be wondering what happened to the image.
The bunch of numbers in the output above shows the cluster membership of each pixel in the original image.
Here is the data for the first row of pixels (which shows the cluster-- 1, 2 or 3-- the pixel belongs to):
The bunch of numbers in the output above shows the cluster membership of each pixel in the original image.
Here is the data for the first row of pixels (which shows the cluster-- 1, 2 or 3-- the pixel belongs to):
Look what happens when you feed those numbers into the Colorize function!
Colorize generates an image from the matrix of pixel-cluster-membership, using a specific color for each cluster 1, 2 or 3.
Colorize generates an image from the matrix of pixel-cluster-membership, using a specific color for each cluster 1, 2 or 3.
Problem 3
Problem 3
1) Use Colorize to create a visually interesting output from an image of your choice. Make sure you increase the number of clusters in step 2 to get more than at least 5 clusters that will be colored differently.
2) Which other function (that you have encountered in this lab) can be used to produce a similar output (with reduced number of colors)?
2) Which other function (that you have encountered in this lab) can be used to produce a similar output (with reduced number of colors)?
Part 4: Natural Language Processing
Programming without Code
Programming without Code
Wolfram Notebooks have an option to provide computational input in natural language (English) instead of code. Move you cursor around till you get the horizontal cell insertion bar as follows:
Place your cursor at the end of the following cell and hit Enter to evaluate:
create a bar chart of the population of countries in north america
distance of earth from the sun
jane austen's novels publication dates
Problem 4
Problem 4
Provide instructions in English to get the notebook to show you information about earthquakes in Japan in the year 2011.
Transcribing and Annotating Audio
Transcribing and Annotating Audio
Here is an example of some audio data:
We can use AudioPlot to visualize the audio signal:
Here is a modified version of the same sentence.
Use AudioPlot to see how the signal changes:
Th function SpeechRecognize can be used to transcribe the audio:
The function TextCases can be used to identify the nouns, verbs, adjectives and adverbs:
The function TextStructure can be used to display the grammatical structure of a sentence:
Problem 5
Problem 5
Use the function AudioCapture to record your own speech.
Transcribe the spoken words and either
a) identify the nouns, verbs, adjectives and adverbs in your speech
or
b) show the grammatical structure of the sentence you have spoken
a) identify the nouns, verbs, adjectives and adverbs in your speech
or
b) show the grammatical structure of the sentence you have spoken
Submitting your work
1
.Ensure you have filled in your NetID at the top of the notebook
2
.Save the notebook as a PDF file (Alternately, "Print to PDF" but please ensure the PDF looks ok and is not garbled)
3
.Upload to Gradescope
4
.Just to be sure that your submission was received, maybe email your TA (sattwik2@illinois.edu) that you have submitted.


