Create Ontology Graph
Create Ontology Graph
Import CloudObjects
Import CloudObjects
In[]:=
siteDirectory=CloudObject["FoodOntologyGraph"];
In[]:=
entityTypeToMetaDataWithNodes=Import[FileNameJoin[{siteDirectory,"EdgeData.m"}]];allNodesProcessed=Import[FileNameJoin[{siteDirectory,"NodeData.m"}]];allNodesGrouped=Import[FileNameJoin[{siteDirectory,"GroupedNodes.m"}]];
Create basic graph
Create basic graph
Create graph edges from the data, keeping all metadata available as edge properties:
In[]:=
ClearAll[createEdge];createEdge[a_Association,{Key[entityType_],Key[property_EntityProperty]}]:=Property[DirectedEdge[entityType,a["Node"]],Normal[a]];allEdges=Flatten@Values[Values/@MapIndexed[createEdge,entityTypeToMetaDataWithNodes,{2}]];allEdges=DeleteCases[allEdges,Property[DirectedEdge[_,_Missing],___]];allEdges//Length
Out[]=
892
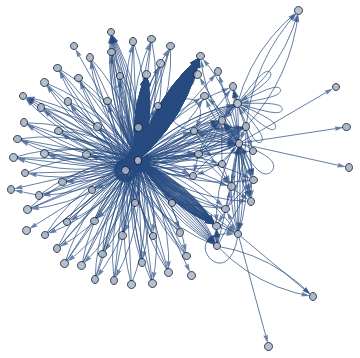
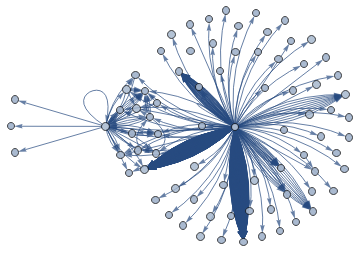
The basic graph is a bit messy:
In[]:=
basicGraph=Graph[allNodesProcessed,allEdges,GraphLayout"SpringEmbedding"]
Out[]=
Remove or hide redundant edges
Remove or hide redundant edges
To clean up the graph, delete any “Name” property edges, as they all go to the “String” data type:
In[]:=
allEdgesSimpler1=DeleteCases[allEdges,Property[DirectedEdge[_,"String"],{___,"Label""name"|"alternative names",___}]];allEdgesSimpler1//Length
Out[]=
835
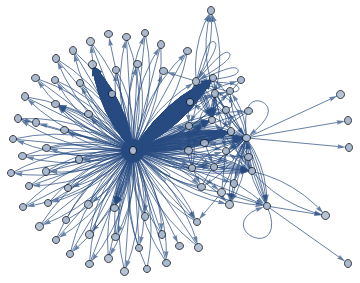
The graph is much cleaner:
In[]:=
simplerGraph1=Graph[allNodesProcessed,allEdgesSimpler1,GraphLayout"SpringElectricalEmbedding"]
Out[]=
Make any “foods” or “strict foods” properties transparent, as all food attribute entities have these two properties.
Keeping the properties around helps keep the nice circular shape which will be useful later.
Keeping the properties around helps keep the nice circular shape which will be useful later.
In[]:=
allEdgesSimpler2=allEdgesSimpler1/.Property[edge:DirectedEdge[_,"Food"],props:{___,"Label""foods"|"strict foods",___}]Property[edge,Append[props,EdgeStyleTransparent]];
In[]:=
allEdgesSimpler2//VertexList//Length
Out[]=
82
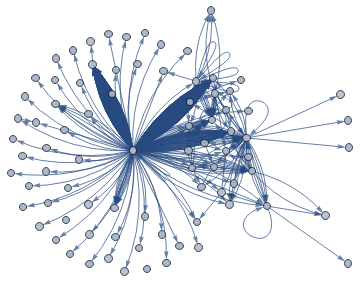
The graph is a bit more simple:
In[]:=
simplerGraph2=Graph[allNodesProcessed,allEdgesSimpler2,GraphLayout"SpringElectricalEmbedding"]
Out[]=
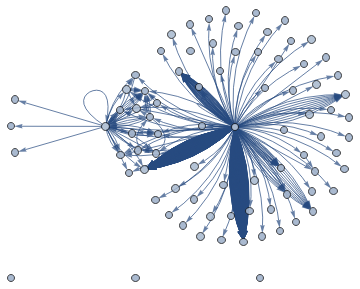
To avoid cluttering the graph, remove edges that connect the special food entity types to another category:
In[]:=
simplerGraph3=EdgeDelete[simplerGraph2,DirectedEdge["LanguaLTerm"|"PLUCode"|"FoodIngredient"|"Nutrient"|"DietaryRestriction",_]]
Out[]=
Doing this disconnects a few entity types from the rest of the graph, so they should be removed:
In[]:=
nodesNoLongerNeeded=Complement[VertexList[simplerGraph3],Flatten[KCoreComponents[simplerGraph3,1]]]
Out[]=
{DateObject,ICDNine,ICDTen}
In[]:=
allNodesGroupedFinal=DeleteCases[#,Alternatives@@nodesNoLongerNeeded]&/@allNodesGrouped;
In[]:=
simplerGraph=VertexDelete[simplerGraph3,nodesNoLongerNeeded]
Out[]=
Build Node index
Build Node index
Go through the nodes and assign them an index:
In[]:=
simplerGraphFinal=simplerGraph;MapIndexed[(simplerGraphFinal=SetProperty[{simplerGraphFinal,#1},"Index"First[#2]])&,VertexList[simplerGraph]];
Group nodes into Communities, add styling
Group nodes into Communities, add styling
This uses CommunityGraphPlot to create a visually appealing and meaningful organization of the ontology graph data.
Definitions
Definitions
Medium images
Medium images
This will be used on the home page, showing just the index number for each node:
Large Images
Large Images
This will be used on the website to zoom in further and see the full label on each node:
PDF
PDF
A PDF provides a way to see the ontology graph as a vector image:
Large PNG
Large PNG
SVG
SVG
HTML Image Map
HTML Image Map
An HTML Image Map allows for adding hyperlinks and tooltips to parts of an image for use in a browser.
Create image map
Create image map
Remove tooltips on the edges for simplicity
Export to the cloud for later use:
At this point, the core of the ontology graph is done! But creating a legend and an edge table will improve readability.
Add a legend (simple)
Add a legend (simple)
Gather all of the data available:
Build a legend using the colors used in the plot:
Create an edge table
Create an edge table
This allows for seeing the edges more clearly in a grid format.
Gather edges into groups
Gather edges into groups
Group the edges by their starting and ending node groups:
Find a list of all edges with complete metadata, given their starting and ending nodes:
Gather the metadata according to the edges between the major groups:
Manipulate data
Manipulate data
Generate display for non-nutrition/quantity properties
Generate display for non-nutrition/quantity properties
This is fairly simple since they are not extremely large:
Export Edge Table as a PDF
Export Edge Table as a PDF
Combine the two grids:
Create a notebook with the proper printing options for it to all fit on one page:
Add a legend (better)
Add a legend (better)
Gather all of the data available:
