◼
Note: I wrote this Wolfram notebook after reading this interesting blog post by Jeremy E. Monat: https://bertiewooster.github.io/2023/12/26/Molecular-isotopes-1-permutations.html
In[]:=
ChlorineAbundances=["IsotopeAbundances"]
Out[]=
,
In[]:=
SulfurAbundances=["IsotopeAbundances"]
Out[]=
,,,
In[]:=
MoleculePlot[Interpreter["Chemical"]["Cl2S"]]
Out[]=
In[]:=
ds=Dataset[Flatten[Table[<|"Chlorine1"->c1,"Chlorine2"->c2,"Sulfur1"->s1,"MolarMass"->c1["MolarMass"]+c2["MolarMass"]+s1["MolarMass"],"RelativeAbundance"->(QuantityMagnitude[ChlorineAbundances[c1]]QuantityMagnitude[ChlorineAbundances[c2]]QuantityMagnitude[SulfurAbundances[s1]])/10^6|>,{c1,Keys[ChlorineAbundances]},{c2,Keys[ChlorineAbundances]},{s1,Keys[SulfurAbundances]}],2]]
Out[]=
In[]:=
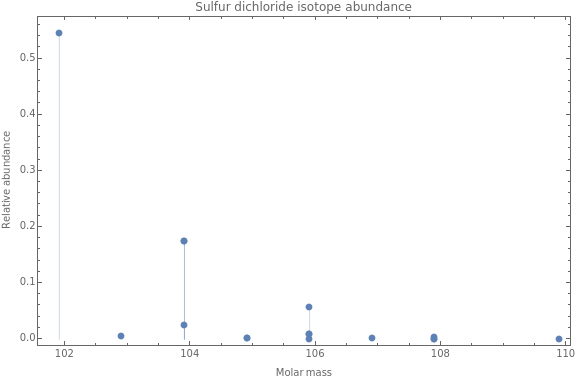
ListPlot[ds[All,{QuantityMagnitude[#["MolarMass"]],#["RelativeAbundance"]}&],Frame->True,FrameLabel->{"Molar mass","Relative abundance"},PlotLabel->"Sulfur dichloride isotope abundance",Filling->Axis,ImageSize->Large]
Out[]=

