Using the Wolfram Language, I want to do the following:
1. Generate sinusoidal time series of a specified frequency and sampling rate
2. Compute the Fast Fourier Transform of that time series (with Fourier[...])
3. Select the positive frequencies
4. Make a ListLinePlot of the frequencies (x-axis) and the magnitude (y-axis)
1. Generate sinusoidal time series of a specified frequency and sampling rate
2. Compute the Fast Fourier Transform of that time series (with Fourier[...])
3. Select the positive frequencies
4. Make a ListLinePlot of the frequencies (x-axis) and the magnitude (y-axis)
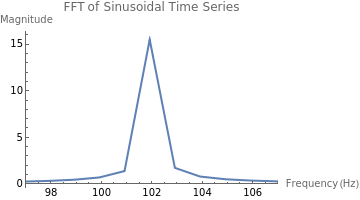
You can achieve this step-by-step in the Wolfram Language. Below is a complete example that covers all four steps: 1. Generate Sinusoidal Time Series: We define a frequency and sampling rate, then create a time vector and generate the sinusoidal series using the sine function.2. Compute the FFT: The function computes the Fast Fourier Transform of the time series.3. Select Positive Frequencies: We calculate the frequencies corresponding to the FFT results and select only the first half (positive frequencies) of the FFT output.4. Plotting: We use to visualize the frequency versus the magnitude of the FFT.You can modify the frequency, , and duration variables to suit your needs. Let me know if you need further assistance!
(*1.Generatesinusoidaltimeseries*)frequency=102;(*FrequencyinHz*)samplingRate=999;(*SamplingrateinHz*)duration=1;(*Durationinseconds*)t=Range[0,duration,1/samplingRate];(*Timevector*)sinusoidalSeries=Sin[2πfrequencyt];(*Sinusoidaltimeseries*)(*2.ComputetheFastFourierTransform*)fftResult=Fourier[sinusoidalSeries];(*3.Selectthepositivefrequencies*)n=Length[fftResult];frequencies=(samplingRate*Range[0,n/2-1])/n;(*Frequencyvector*)magnitude=Abs[fftResult[[1;;n/2]]];(*MagnitudeofFFT*)(*4.MakeaListLinePlotofthefrequenciesvs.magnitude*)ListLinePlot[Transpose[{frequencies,magnitude}],AxesLabel->{"Frequency (Hz)","Magnitude"},PlotLabel->"FFT of Sinusoidal Time Series",PlotRange->{{frequency-5,frequency+5},All}]
Out[]=
