Drag Force Simulation
Drag Force Simulation
About the simulation.
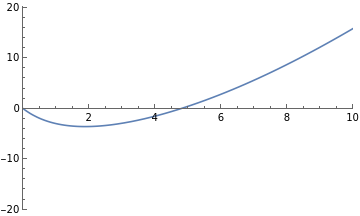
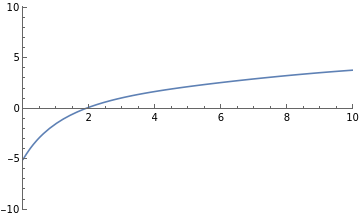
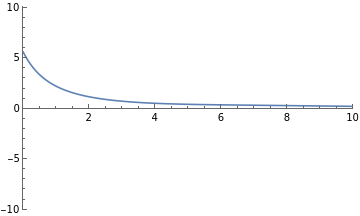
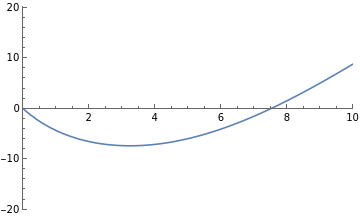
Below is a simulation of the drag force on a ball that is released into some moving fluid (this might be a river, or air on a windy day). The simulation will show the physical motion of the ball and plot position, velocity, and acceleration graphs. Our situation is described by the following:
◼
Gravity and buoyant force act along the z axis
◼
The motion of the fluid is along the x axis.
◼
The overall effect of gravity/buoyancy, the velocity of the river, and the initial velocity of the ball can be adjusted with sliders.
◼
The z axis is the vertical direction in the simulation and the x axis is horizontal. We are watching from a bit away in the y direction.
Instructions
1
.By default, the simulation will have gravity/buoyancy set to 0 and the ball’s initial z velocity set to 0. The x velocity of the river is positive and the balls initial x velocity is negative. In this situation. What would you expect the motion of the object to look like? First try to visualize this without looking at the graphs. If you get stuck, see if you can translate the graphs mentally into the motion of the object. Once you think you have it, click the arrow labeled “Release ball” to watch the object’s motion.
2
.Next you will attempt to determine the effect of changing the ball’s initial x velocity to be the same direction as the river and faster than the river. First, attempt to determine what the physical motion of the object will look like, and what each motion graph will look like. Then adjust the sliders so that the ball’s x velocity is 8 and the river velocity is 2. Compare the simulated graphs and simulated motion to your graphs and mental simulation. Do they match?
3
.Now we want to think about the effects of changing z values. Go ahead and turn both river x velocity and initial ball x velocity to 0 now. If we leave the ball’s x velocity at 0, but set the gravity/buoyancy to something less than 0 (ie gravity wins), what should the graph and the motion of the ball look like? Once you have the graphs drawn, and have a clear mental image of the motion, check your answer with the simulation.
4
.What settings for the sliders would result in both position graphs appearing similar to upward opening parabolas that both cross 0? What would the physical motion of the object look like in both cases. First try to determine settings that would produce this without changing anything, then verify your answer by setting the bars appropriately. Also check your mental video of the motion against the actual motion.
5
.Play with the simulation for a while. Keep adjusting the sliders until you get an intuition for what each change is going to have. Make sure that you are thinking about what the sliders physically represent as you do this. Now come up with a shape for one or more of the graphs and try to set values that produce that.
6
.If you want to really challenge your intuition, try to determine why changing the z values has an effect on x and changing the x values has an effect on z. This is substantially beyond what will be required of you for this class, so don’t worry if you can’t figure it out.
Out[]=
Out[]=

