Wolfram Machine Learning | Things to Try

Make edits and run any piece of code by clicking inside the code and pressing
+
.
Machine Learning & Neural Networks. From production-grade classic machine learning to modern artificial intelligence, with deep integration with statistical analysis, visualization, image processing and more to build intelligent systems.

Use and Train Classifiers

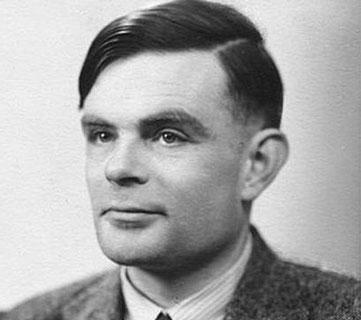
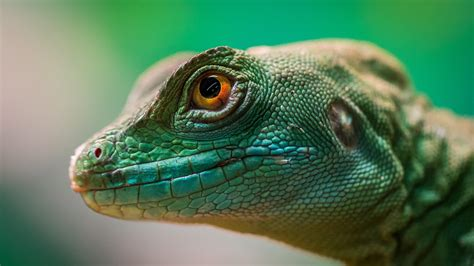
Use a pre-trained classifier to recognize images:
Run
Classify"NotablePerson",
Use a pre-trained language classifier on text:
Run
Classify["Language","the house is blue","la maison est bleue","la casa es azul","das Haus ist blau","","المنزل باللون الأزرق","будинок синій"]
Pre-trained models are used in many other functions:
Run
ImageIdentify
,
,
,SpecificityGoal->"Low"
Train your own classifiers with high-level code:
Run
topicClassifier=Classify"the cat is grey"->
,"my cat is fast"->
,"this dog is scary"->
,"the big dog"->
Use your trained model:
Run
topicClassifier[{"nice cat","what a dog"}]

Cluster Analysis

Find clusters in data:
Run
ListPlotFindClusters
GaussianDisks
Specify method and other options for greater control:
Run
ListPlotFindClusters
Rings
,Method->"DBSCAN"
Analyze clusters in the context of graphs:
Run
CommunityGraphPlot[ExampleData[{"NetworkGraph","JazzMusicians"}]]
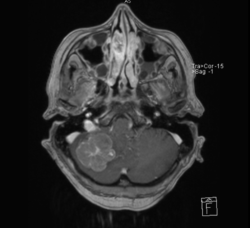
Analyze components in images:
Run
ClusteringComponents
,7//Colorize

Dimensionality Reduction

A color function shows that the structure of data can be embedded in a lower dimension space:
Run
ListPointPlot3D
Higher Dimension Data
,ColorFunction->Hue0.5-0.5
Total[
2
{#1,#2}
]
&,ColorFunctionScaling->False,
Options
Create a dimension-reducing function for this dataset:
Run
dr=DimensionReduction
Higher Dimension Data
,Method->"Isomap"
Apply the dimension-reducing function to the data:
Run
ListPlotdr
Higher Dimension Data
,ColorFunction(Hue[0.5#1]&)

Detect Anomalous Data

Retrieve information from a classic dataset:
Run
In[]:=
irisdata=ResourceData["Sample Data: Fisher's Irises"][All,{"PetalLength","SepalWidth"},QuantityMagnitude];
Create an anomaly detection function:
Run
detector=AnomalyDetection[irisdata]
Use the detector function to find anomalies in the dataset:
Run
anomalies=FindAnomalies[detector,irisdata]
Visualize the data and decision boundary:
Run
ShowContourPlotdetector[{x,y},"RarerProbability"],{x,-1,9},{y,1,5},
Options
,ListPlot{irisdata,anomalies},
Options

Impute Values for Missing Data

Simulate missing data by removing some information from a dataset:
Run
incompletedata=
Data
/.{x_/;4<x<5,y_}:>{x,Missing[]};ListPlot[incompletedata]
Train a distribution to predict missing values:
Run
{nonmissingdata,missingdata}=GatherBy[incompletedata,MemberQ[_Missing]];ld=LearnDistribution[nonmissingdata]
Synthesize the missing values and plot the results:
Run
synthesized=SynthesizeMissingValues[ld,missingdata];ListPlot[{incompletedata,synthesized}]

Train and Study Neural Networks

Retrieve a classic dataset for classification:
Run
In[]:=
trainingdata=ResourceData["MNIST","TrainingData"];testdata=ResourceData["MNIST","TestData"];SeedRandom[1234];RandomSample[trainingdata,5]
Out[]=
9,
4,
0,
2,
5
Train a model on the data (this may take longer to evaluate):
Run
In[]:=
trainedNet=NetTrain[NetModel["LeNet"],trainingdata,MaxTrainingRounds->2]
Out[]=
NetChain
Input
port:
image
Output
port:
class
Data not saved. Save now
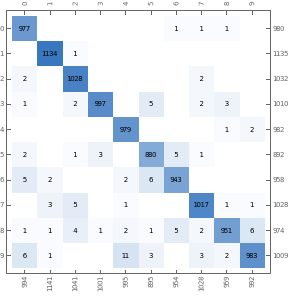
See how the trained network performs:
Run
NetMeasurements[trainedNet,testdata,{"Accuracy","ConfusionMatrixPlot"}]
Out[]=
0.9889,
actual class
predicted class

Computer Vision

Natural Language Processing

Speech Analysis

Wolfram Cloud

You are using a browser not supported by the Wolfram Cloud

Supported browsers include recent versions of Chrome, Edge, Firefox and Safari.


I understand and wish to continue anyway »

You are using a browser not supported by the Wolfram Cloud. Supported browsers include recent versions of Chrome, Edge, Firefox and Safari.