Section 1.4: Introduction - Phase space
Section 1.4: Introduction - Phase space
Let’s go back to the example of the pendulum. We said that the equation is governed by:
x''(t)+sin(x(t))=0
g
l
Well, before we called it θ not but that’s ok - we should be comfortable changing names of variables. Just for reference, you can solve this and it’s given by:
x
In[]:=
x[t]±x[t]/.DSolvex''[t]+Sin[x[t]]0,x,t[[1]]//Quiet
g
l
Out[]=
x[t]±2JacobiAmplitude),
2g+l
(t+
1
2
2
l
4g
2g+l
1
Where and are constants of integration. This is something called a “Special Function” and you don’t need to know about it at all, but this is just to show that there is a solution even if it’s kinda complicated.
c
1
c
2
OK, so we’re going to use this example to understand about an idea called Phase Space. Let’s first of all take this second order equation and convert it to two second order equations. Let’s let (t)=x(t) and (t)=x’(t).
x
1
x
2
We’re just relabeling as and we’re defining a new variable which is really just the rate of change of .
x
x
1
x
2
x
Doing this gives us two equations:
x
1
x
2
x
2
g
l
x
1
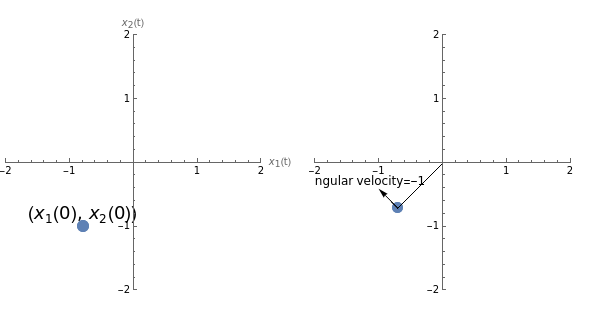
Here we have two first order differential equations, and to solve them we will need two initial conditions: one, let’s say, for (0) and one for (0) . This would correspond to the initial angular position and angular velocity of the pendulum. Now comes the fun part. We can now plot this position in a two dimensional plane, called the phase space of the problem. Let’s say that the initial angular position is and the initial angular velocity is -1. This would correspond to one position in the phase space and correspond to the pendulum at a certain point, swinging with a certain velocity.
x
1
x
2
-
π
4
In[]:=
pos=Sin,-Cos;args={PlotStylePointSize[0.04],PlotRange{{-2,2},{-2,2}},AspectRatio1};GraphicsGridShowListPlot,-1,args,AxesLabel{"(t)","(t)"},GraphicsTextStyle["((0), (0))",18],,-0.8,ShowListPlot[Re[{pos}],args],Graphics[Line[{{0,0},pos}]],Graphics[Arrow[{pos,pos-{0.3,-0.3}}]],GraphicsTextStyle["angular velocity=-1",12],--0.4,-0.3
-π
4
-π
4
-π
4
x
1
x
2
x
1
x
2
-π
4
π
4
Out[]=
Remember, and this is key, that (t) is really the angular velocity.
x
2
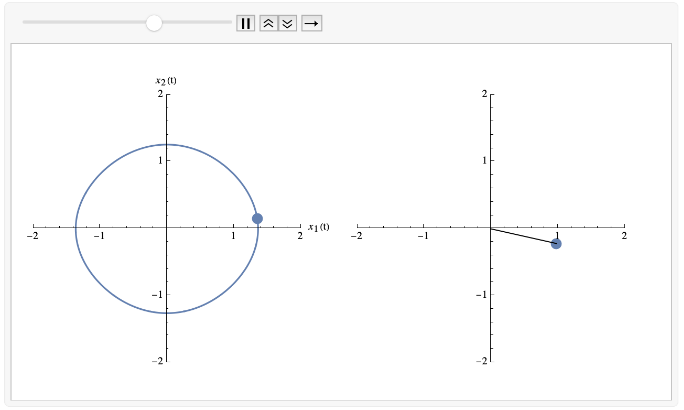
So that is a single moment in time. What happens as we roll time forward - ie. starting at that position in phase space (corresponding to an initial angular position and velocity). Well, it’s going to trace out a path in the phase space, which might look something like this:
What we see here is on the left the path taken through phase space. At any one time the pendulum position is given by a single point in the phase space corresponding to a single position, and angular velocity. As we roll time forward, we move to different points in phase space. There are a few things to note:
1) The path in phase space is periodic - after a certain amount of time, we get back to where we started, not just in terms of position, but also velocity. That should make sense for a swinging pendulum.
2) When we cross the axis, this corresponds to the moments where is zero, which corresponds to the angular velocity being zero. These points are when the pendulum has momentarily stopped at the far left and right of its swing.
x
1
x
2
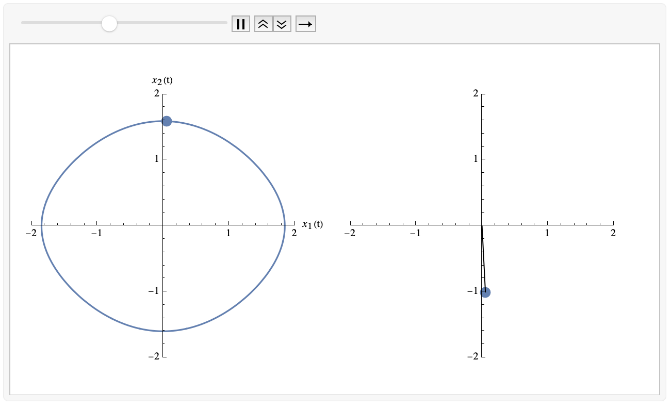
This was a very particular starting position in phase space. Let’s look at another:
This time we are starting with a slightly higher angular velocity (of -1.4, rather than -1) which is enough to take us slightly over the horizontal.
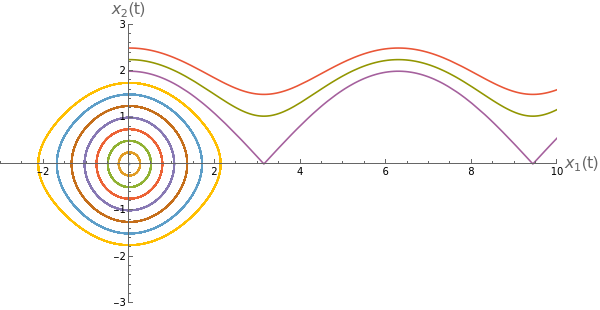
The point is that you can start anywhere in phase space that you want, and it will also give you some solution. Actually, let’s look at a whole range of solution all together in phase space. See if you can figure out what’s going on for these
In[]:=
xsol[t_,xv_]:=Module[{},sol=NDSolve[{x''[t]+Sin[x[t]]0,x[0]0,x'[0]xv},x,{t,0,100}][[1]];{x[t],x'[t]}/.sol];ParametricPlot[Evaluate[xsol[t,#]&/@Range[0,2.5,0.25]],{t,0,100},PlotRange{{-3,10},{-3,3}},AspectRatio1/2,AxesLabel{Style["(t)",16],Style["(t)",16]},ImageSize600]
x
1
x
2
Out[]=
If we had a particle moving around in three dimensional space, then at any point in time, it can be completely described by its position and its velocity. Each of these is a three dimensional quantity, and so the phase space is six dimensional...and we’re not going to try and plot that.
In fact in this course we are almost exclusively going to be dealing with one dimensional problems (which have a two dimensional phase space).
These types of problems are called “Problems on the line” - because the position of our “thing” is given by just a single number (like we had the angle of the pendulum above). The phase space is going to be 2d, and we’re going to see what we can discover about these systems without going to the hassle of solving the differential equations.
One little additional possibility that we haven’t considered is a system where the time is explicit in the equation itself. For instance:


