MAM2046W - Second year nonlinear dynamics
Section 1.1: Phase portraits in two dimensions
Before we start, I will use phase portrait, phase diagram and phase plane somewhat interchangably.
As discussed in section 0, the last thing that we studied in MAM1043H was two-dimensional linear systems. We found that there were a number of different possible behaviours (essentially different kinds of fixed points), depending on the trace and determinant of the matrix . This is all well and good, but most systems are not linear. However, will use some of the same techniques that we used for non-linear one-dimensional systems to see what happens when we can make some linear approximation of a non-linear system. Don't worry about it at the moment, this will all become clear soon!
A
Let’s remind ourselves now of what we mean by a two-dimensional non-linear system. We will be looking at dynamical systems of the form
x
1
f
1
x
1
x
2
x
2
f
2
x
1
x
2
where and can be any nonlinear function and we remember that the dot is a derivative with respect to time...we are dealing with dynamical systems here. We can follow on from the notation that we used before for the linear system, but we can’t write the function as a matrix. Instead we write:
f
1
f
2
x
where and . Make sure that you can see how to go between the two forms of notation.
x=(,)
x
1
x
2
f=(,)
f
1
f
2
Let’s remind ourselves quickly about how we can represent the different types of solution for a dynamical system. In one dimensional we had a flow on the line. Where the whole of ‘space’ was depicted as a line, and we represented the dynamics of the system as arrows along the line pointing towards or away from fixed points. We could encapsulate all of the dynamics of the system in that case by plotting versus in a two-dimensional plot. We could then plot for a given solution, or set of solutions.
x
x
x(t)
In the case now of a two-dimensional system we are mostly going to be interested in the phase portrait. In this case we will be plotting curves in the plane (the phase plane). We did this already for linear systems in two dimensions, and as mentioned before, we got various types of fixed points, and behaviour of the solution around the fixed points. Remember that specifying a single point in the phase plane will uniquely (up to some cases similar to the non-unique one-dimensional cases) determine all future behaviour.
(,)
x
1
x
2
Solutions will then be curves in the phase plane. What information you miss from the phase portrait, remember, is how fast you are going along these lines in time. In order to see that, it’s then easiest to simply plot separately (t) and (t).
x
1
x
2
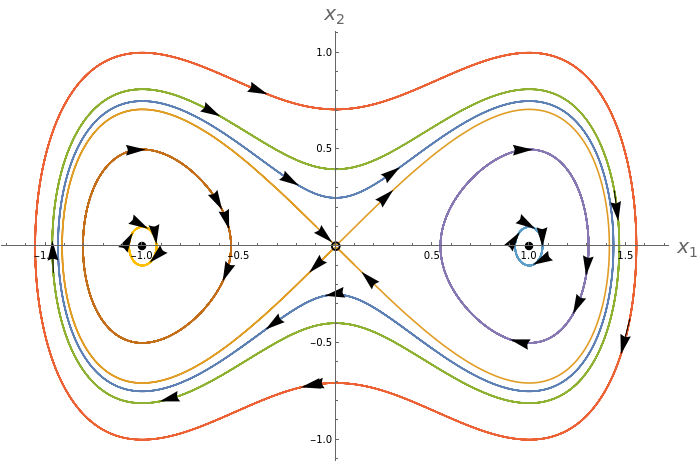
Here I just give an example of a phase portrait for a particular two dimensional non-linear system
x
1
x
2
x
2
x
1
3
x
1
Note that it’s only non-linear because of the term.
3
x
1
I’m just plotting the full phase portrait here. You aren’t expected to be able to do this, but we will use it for illustrative purposes.
In[]:=
sol[a_,b_]:=NDSolve[{x'[t]==y[t],y'[t]==x[t]-,x[0]==a,y[0]==b},{x,y},{t,-40,40}]func[t_,a_,b_]:={x[t],y[t]}/.sol[a,b][[1]]func[t,#[[1]],#[[2]]]&/@{{0,0.25},{0.1,0.1},{0.75,0.75},{1,1},{1,0.5},{-1,0.5},{1,0.1},{-1,0.1}};p1=Show[ParametricPlot[%,{t,-20,20}],Graphics[{Arrowheads[0.03],Arrow[{#/.t->1,#/.t->1.1}]}&/@%],Graphics[{Arrowheads[0.03],Arrow[{#/.t->6.3,#/.t->6.4}]}&/@%],Graphics[{Arrowheads[0.03],Arrow[{#/.t->-5.1,#/.t->-5}]}&/@%],Graphics[{Arrowheads[0.03],Arrow[{#/.t->-13.15,#/.t->-13.05}]}&/@%],ListPlot[{{-1,0},{1,0}},PlotStyle->Black],Graphics[{Thick,Circle[{0,0},0.02]}],AxesLabel(Style[#,20]&/@{"",""}),ImageSize->700]
3
x[t]
x
1
x
2
Out[]=
We will study this example in more detail later, but already we can see a number of different features. We can see cycles going around two fixed points, we see cycles going around both fixed points (the green and red lines), and we can see a type of fixed point in the middle. All of this to be discussed later.
In the previous course, as we will in this one, we tried to get general features of a system, without actually having to solve the equations explicitly, as this is often either impossible, or if not impossible, the solutions are so complicated that they don’t help us to understand what’s going on. We want to be as lazy as possible, but no lazier.
So, what sort of features will be able to find the easy way? Well, for fixed points, these are the solutions for which nothing changes over time, so we must have
x
1
x
2
In the case of the plot above, this is equivalent to:
0=
x
2
0=-
x
1
3
x
1
which is solved by And indeed this does correspond to the fixed points.
(,)=(-1,0),(1,0)and(0,0).
x
1
x
2
How about the closed cycles? Well, these ones must be periodic - ie. for some period . This means that a time after any given time you will find yourself back where you were at time .
((t+T),(t+T))=((t),(t))
x
1
x
2
x
1
x
2
T
T
t
t
We are also going to want to study about what is happening close to the fixed points. Are the lines flowing in or out? In what direction are they headed, or are you purely orbiting the fixed points? And in a similar vein, what are the types of fixed points that we can have?
We are going to have a new feature as well - closed cycles, which are kind of like fixed points, but they aren’t points - they are periodic orbits...we can either have stable, or unstable, or indeed semi-stable ones.
The dynamics as a vector field
You will often see the dynamical equations
x
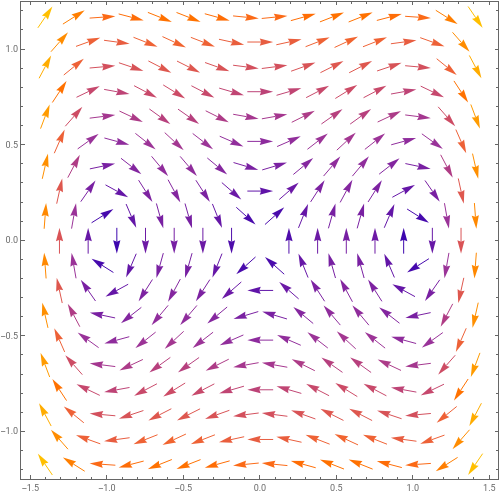
described as a vector field. The reason for this is that if you pick any points in the phase plane, then this equation will tell you the direction of the flow at that point, and you can think that over the whole phase plane are vectors pointing in different directions. We can’t plot all of them, but we can plot a selection.
(x,y)
Taking the example above:
x
1
x
2
x
2
x
1
3
x
1
We could ask what is happening at the point ’d find that:
(2,2)andwe
x
1
x
2
So we would put an arrow pointing in the Doing this over a region of the phase plane we would get:
(2,-6)direction.
In[]:=
p2=VectorPlot[{x2,x1-},{x1,-1.5,1.5},{x2,-1.2,1.2},AxesLabel(Style[#,20]&/@{"",""}),ImageSize->500]
3
x1
x
1
x
2
Out[]=
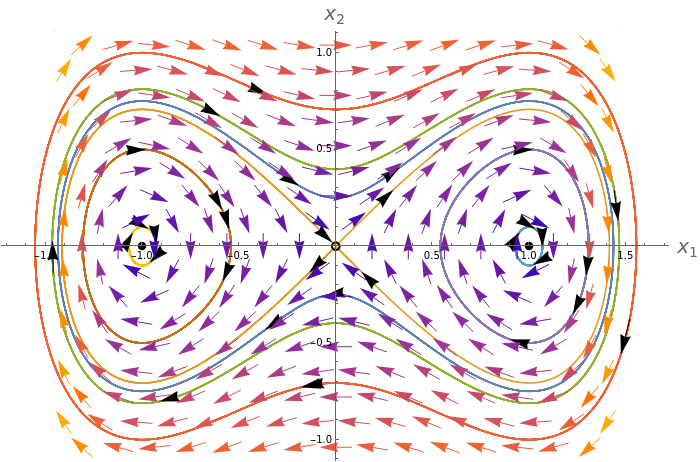
Which, when we put the trajectories on top seem to match up nicely:
In[]:=
Show[p1,p2]
Out[]=
So when we refer to a set of equations as a vector field, this is why.
Numerical solutions
In addition to being able to get the general features, there are a number of ways of calculating flows in the phase space numerically (this means without finding the analytic - ie. exact - solutions). Here I’m going to give you the equations for a particular method of doing this and I’m not going to tell you a lot more. Try and do this in Python, or, if you know it, Matlab. It doesn’t matter if you don’t get it. I mostly want you to experiment with it.
Let’s first think about how we might take a continuous differential equation and discretise it. Starting with:
We can try and approximate the derivative as:
Taking the naive approach we can write:
There are many ways to improve the above method to make it a more accurate approximation of the continuous differential equation, and one of them is the Runge-Kutta method:
This may seem very very complicated, but basically this allows us to get a better approximation to the equation than the naive approach above.
Exercise
Take the equations
1) Find the fixed point of this system of equations. Plot this point in the phase diagram.
The above will give some information about the phase diagram. Now use the method of direction fields that we looked at in MAM1043H to fill in the rest of the diagram. If you’re feeling brave, try and find some flows in the phase diagram using the Runge-Kutta method.