MAM2046W - Second year nonlinear dynamics
MAM2046W - Second year nonlinear dynamics
Section 3.2: Hopf bifurcations
Section 3.2: Hopf bifurcations
So, it seems that everything is the same in two dimensions as it was in one dimension in terms of bifurcations...but actually, if we dig a little deeper we will see that there is more to understand here.
In one dimension, a single fixed point on its own can’t go from being stable to unstable. If it becomes unstable, then two other stable fixed points must have appeared from somewhere (a pitchfork bifurcation).
We will see now that in two dimensions, it’s limit cycles that bring in some novel, interesting behaviours. What we will show is that a fixed point can go from being stable to unstable essentially by the action of a limit cycle engulfing it, or moving away from it. This can happen in two ways.
We’re going to start off with an example and then explore what’s happening.
We start with the vector field in polar coordinates given by
r
3
r
5
r
θ
2
r
We see here three parameters, but let’s set two of them to fixed values. Playing around, I found that were good for visualisation.
ω=0.1andb=0.1
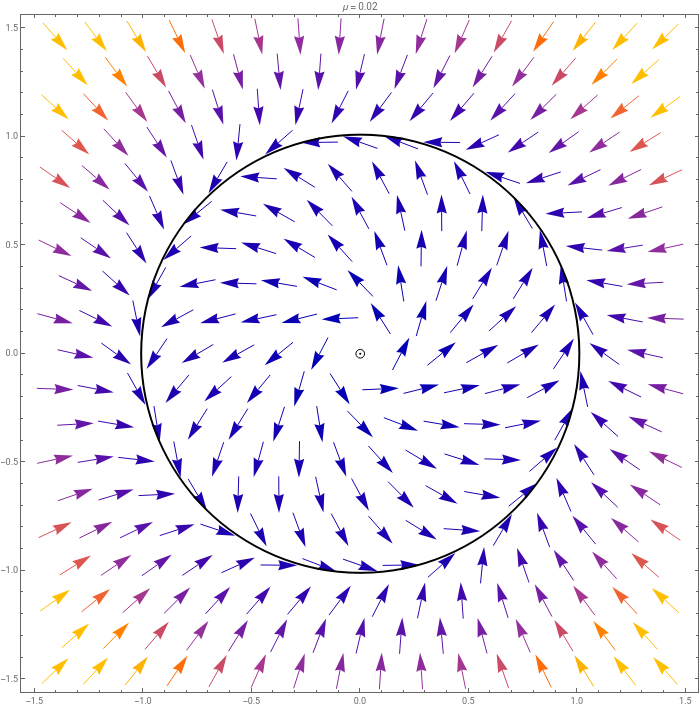
In the following animation, I let μ vary from -0.4 to 0.2. You will see circles appear. The dashed circle is an unstable limit cycle and the undashed circle is a stable limit cycle. We’ll explore this below.
In[]:=
eqns=SimplifySolveD+,t==μ-,DArcTan,t==0.1+0.1(+),{x'[t],y'[t]}[[1]]//FullSimplify;vf[μ_]=({x'[t],y'[t]}/.eqns)/.x[t]->x/.y[t]->y;TableShowVectorPlot[vf[μ],{x,-1.5,1.5},{y,-1.5,1.5}],IfIm1-==0,GraphicsDashed,Thick,Circle{0,0},1-,Graphics[Circle[{0,0},0]],IfIm1+==0,GraphicsThick,Circle{0,0},1+,Graphics[Circle[{0,0},0]],If[μ<0,Graphics[Disk[{0,0},0.02]],Graphics[Circle[{0,0},0.02]]],PlotLabel->"μ = "<>ToString[μ],ImageSize->700,{μ,-0.4,0.2,0.02};ListAnimate[%,2,SaveDefinitions->True]
2
x[t]
2
y[t]
(+)
+2
x[t]
2
y[t]
3
(+)
2
x[t]
2
y[t]
5
(+)
2
x[t]
2
y[t]
y[t]
x[t]
2
x[t]
2
y[t]
1
2
1+4μ
1
2
1+4μ
1
2
1+4μ
1
2
1+4μ
Out[]=
What’s happening here?
Well, because of the rotational symmetry of the problem, the limit cycles will be circles of fixed radius about the origin, so to find them we just have to find when
4->
r
3
r
5
r
which has solutions
r=0,-,,-,
1-
1+4μ
2
1-
1+4μ
2
1+
1+4μ
2
1+
1+4μ
2
We are only interested in positive values of r (r=0 is a fixed point) so we have:
r
limitcycle
1-
1+4μ
2
1+
1+4μ
2
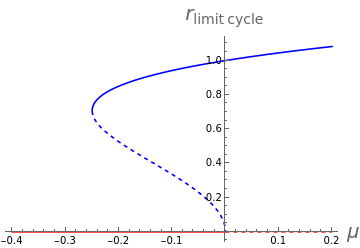
but in fact these are only real for certain values of μ. Plotting these along with the nature of the fixed point at zero we see:
In[]:=
ShowPlot,,{μ,-0.4,0.2},PlotStyle->{{Blue,Dashed},Blue},AxesLabel->Evaluate[Style[#,20]&/@{"μ",""}],Plot[0,{μ,-0.4,0},PlotStyle->Red],Plot[0,{μ,0,0.2},PlotStyle->{Red,Dashed}]
1-
1+4μ
2
1+
1+4μ
2
r
limitcycle
Out[]=
Where as usual dashed lines correspond to instability, though we have to be careful here about the limit cycles (blue), for .
r>0,andthefixedpoint(red)atr=0
Note that we have what is a bifurcation happening at , where suddenly the radius of the limit cycle becomes real and a stable and unstable limit cycle appear. Note that this point is NOT the Hopf bifurcation. That happens at μ=0. We also have a rather interesting thing happening as the unstable limit cycle collapses in to the origin and changes the nature of the fixed point from stable to unstable. We’ve never seen that before.
μ=-
1
4
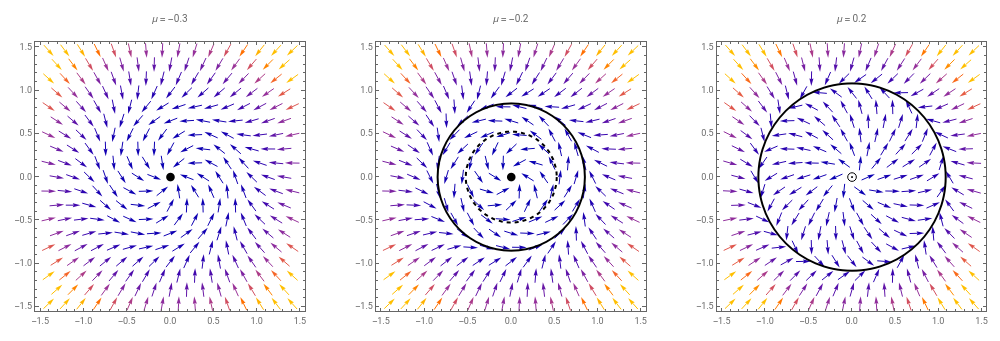
Let’s just plot three specific values of μ:
In[]:=
eqns=SimplifySolveD+,t==μ-,DArcTan,t==0.1+0.1(+),{x'[t],y'[t]}[[1]]//FullSimplify;vf[μ_]=({x'[t],y'[t]}/.eqns)/.x[t]->x/.y[t]->y;pl[μ_]:=ShowVectorPlot[vf[μ],{x,-1.5,1.5},{y,-1.5,1.5}],IfIm1-==0,GraphicsDashed,Thick,Circle{0,0},1-,Graphics[Circle[{0,0},0]],IfIm1+==0,GraphicsThick,Circle{0,0},1+,Graphics[Circle[{0,0},0]],If[μ<0,Graphics[Disk[{0,0},0.05]],Graphics[Circle[{0,0},0.05]]],PlotLabel->"μ = "<>ToString[μ],ImageSize->500GraphicsGrid[{pl[#]&/@{-0.3,-0.2,0.2}},ImageSize->1000]
2
x[t]
2
y[t]
(+)
+2
x[t]
2
y[t]
3
(+)
2
x[t]
2
y[t]
5
(+)
2
x[t]
2
y[t]
y[t]
x[t]
2
x[t]
2
y[t]
1
2
1+4μ
1
2
1+4μ
1
2
1+4μ
1
2
1+4μ
Out[]=
In the first we have no limit cycle and a stable fixed point at 0. In the second we have a stable and unstable limit cycle and a stable fixed point at 0, and in the third we have a stable limit cycle and an unstable fixed point.
The part of this where the unstable limit cycle shrinks to zero size and engulfs the stable fixed point, turning it into an unstable fixed point is called a Hopf Bifurcation. Actually, this is a Subcritical Hopf bifurcation. We will look at the supercritical one in a bit. Note again that the sudden appearance of the stable and unstable limit cycles is not the Hopf bifurcation. That is a saddle bifurcation of limit cycles.
Taking some snapshots of this we have:
Notice how we start off with everything being attracted to the fixed point, then the outer solution start to get attracted to the outer limit cycle, and finally all solutions get attracted to the out limit cycle. The important thing though is that the large starting condition gets, in some sense, gradually attracted to the stable limit cycle, whereas the small start condition has a sudden jump.
The important point here is that the small amplitude oscillation goes from being attracted to zero to quickly jumping to a large amplitude oscillation as we pass the critical value of μ. This is a so-called Subcritical Hopf Bifurcation.
To understand a bit more about what’s happening in terms of the fixed point, we will look at the Eigenvalues of the Jacobian at the fixed point at the origin.
Plugging in the equations of motion for this system we get:
and converting the right hand side back to Cartesian coordinates we have:
The Jacobian for this is
Rather than studying this in terms of the determinant and trace, let’s actually find the eigenvalues. Well, you should be able to show that these are:
Supercritical Hopf Bifurcations
We’ve focused here in subcritical Hopf Bifurcations, which in some sense are the more ‘violent’ type. Where there is a sudden jump of the fixed point in the centre from stable to unstable, with the nearest stable point being some way away.
A prototypical example of a supercritical Hopf Bifurcation is:
All of the eigenvalue calculations go through as before, we we have
and so we know that at μ=0 we will go from having a stable fixed point at 0 to an unstable one. However, it is the nature of the limit cycle that is different. Here there is only a limit cycle at
So now our diagram looks like:
There is no value for which there is an unstable limit cycle, and so here, when you have small oscillations, as you increase μ they will go gradually from decaying, to having periodicity in a smooth way.
Here everything happens smoothly, and is reversible. That is that as you increase and decrease μ, you can smoothly go from the limit cycle to the fixed point limit. In the subcritical case there is a sudden change which can’t be reversed. This is hysteresis, and essentially corresponds to following the following trajectory:
|The subcritical Hopf bifurcation is a dangerous thing to find, and can occur in engineering situations where vibrations suddenly occur, and are very hard to get rid of without a large change in the parameters of your system. They also occur in neurons.
In fact there is a third type of Hopf Bifurcation which can occur called a Degenerate Hopf Bifurcation, though in this case there is no limit cycle at all.
Looking an example of this
We have the following:


