MAM2046W - Second year nonlinear dynamics
Section 3.3: Oscillating chemical reactions
In this section we’re going to look at a model for a complex chemical reaction, which involves chlorine dioxide, iodine and malonic acid:
In[]:=
GraphicsGrid[{ChemicalData["ChlorineDioxide",#],ChemicalData["MalonicAcid",#],ChemicalData["Iodine",#]}&/@{"CHColorStructureDiagram","MoleculePlot"},ImageSize->1000]
Out[]=
The chemical details don’t matter at all here, but it turns out that a dynamical model of the concentrations of iodine and chlorine dioxide by
(x)
(y)canbegiven
x
4xy
1+
2
x
y
y
1+
2
x
The parameters are related to chemical properties set outside of the concentration of these two chemicals (ie. these are constants within this system), and are both greater than 0.
aandb
We might look at this and be at a bit of a loss to know how to analyse it. The first thing that would seem sensible to look at would be the fixed points, and the null-clines.
The fixed points are clearly given by
0=a-x-
4xy
1+
2
x
0=bx1-
y
1+
2
x
we can see that the second equation has a zero when that into the first gives , and because we know that the constants are both positive, can’t be a fixed point. So we look at the second term in the second equation:
x=0,butplugging
0=a
x=0
1-=0⟹y=1+
y
1+
2
x
2
x
Plugging this into the first equation gives us
0=a-x-⟹a-5x=0⟹=,=1+
4x(1+)
2
x
(1+)
2
x
*
x
a
5
*
y
2
a
25
So the fixed point is dependent on Now finding the null-clines just means plotting for
aonly.
x
y
separately.
The first of these is given by:
0=a-x-⟹y=for =0
4xy
1+
2
x
(1+)(a-x)
2
x
4x
x
and the second:
0=bx1-⟹x=0ory=1+for =0
y
1+
2
x
2
x
y
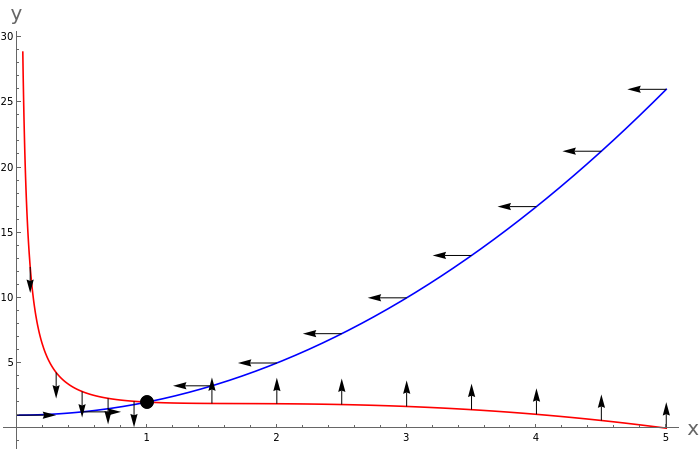
We can plot these curves and put on characteristic arrows corresponding to the lack of flow along them. Let’s choose a=5 so that the fixed point is at (1,2):
xory
In[]:=
pl1=ShowPlot(1+),1+,{x,0,5},PlotStyle->{Red,Blue},ListPlot[{{1,2}},PlotStyle->{PointSize[0.02],Black}],Graphics[{Arrowheads[.02],Arrow[{{#,1+},{#+Which[#<1,0.3,#==1,0,#>1,-0.3],1+}}]}&/@Range[0,5,0.5]],GraphicsArrowheads[.02],Arrow#,(1+),#,(1+)+Which[#>1,2,#==1,0,#<1,-2]&/@Join[Range[0.1,1,0.2],Range[1,5,0.5]],ImageSize->700,AxesLabel->Evaluate[Style[#,20]&/@{"x","y"}]
2
x
(5-x)
4x
2
x
2
#
2
#
2
#
(5-#)
4#
2
#
(5-#)
4#
Out[]=
These arrows are not showing the magnitude of the flow, just the direction. Make sure that you can see why some are pointing left and some right, some up and some down.
ok, so we see something maybe a bit interesting here...it looks like we might have something like a cycle about the fixed point occurring here.
At this stage we should think about Poincaré-Bendixson, and for that we need to find a trapping region. Remember this is a region which can’t contain a fixed point, but where all arrows on the boundary point into it. We don’t have quite enough yet to build this.
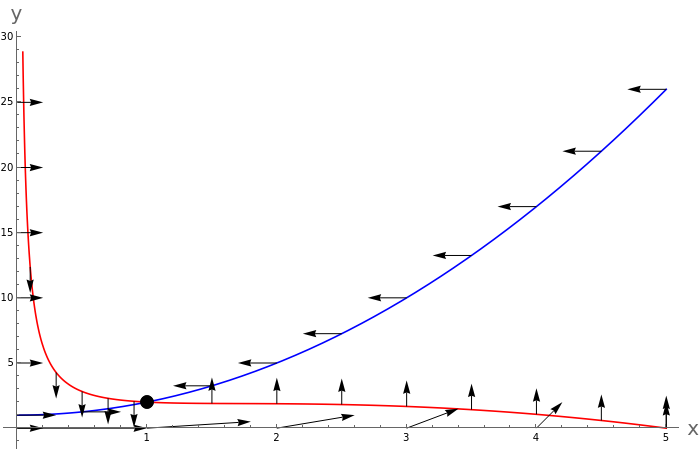
Let’s also add on the vectors on the axes (at least their direction, if not magnitude.
Well, along the x-axis, we have
(,)=(a-x,bx)
x
y
So these are always pointing up for positive they will have a component pointing to the right or left depending on where in relation to . And along the y-axis we have:
xthough
xis
a
(,)=(a,0)
x
y
so always pointing right. Putting this together, with a bit of artistic license, we have:
In[]:=
Showpl1,Graphics[{Arrowheads[.02],Arrow[{{0,#},{0.2,#}}]}]&/@Range[0,25,5],GraphicsArrowheads[.02],Arrow{#,0},#+,&/@Range[0,5,1]
(5-#)
5
#
2
Out[]=
How can we create a trapping region here? Well, we know that the y-axis has arrows with positive , and the x-axis always has arrows with positive . Can we create a box where from all sides, arrows are pointing in?
x
y
which gives
which implies:
So we can choose the top of our box to be infinitesimally above this value of y:
OK, so we have a trapping region apart from the fixed point. If we can excise the fixed point and show that it is a repeller, then we are done and we have a stable limit cycle. So when is this fixed point a repeller?
which has trace and determinant:
the determinant is clearly always positive. Now the question is the sign of the trace. If it is positive, then we have a repeller (spiral, star or node), and this occurs when:
Which, given that a and b are positive gives:
What happens at the boundary in between? Well, a limit cycle appears from the fixed point, so this is a Hopf Bifurcation.