1.6 AutoEncoding
1.6 AutoEncoding
1.6.1 Concept of AutoEncoding
1.6.1 Concept of AutoEncoding
In[]:=
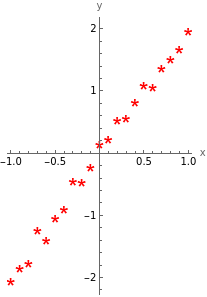
x=Range[-1,1,0.1];
In[]:=
y=Map[2#+RandomReal[{-0.2,0.2}]&,x];
In[]:=
vectors=Transpose[{x,y}];
In[]:=
p0=ListPlot[vectors,PlotStyleRed,PlotMarkers{"*",Large},AspectRatio1.5,AxesLabel{"x","y"}]
Out[]=
In[]:=
G=Total[MapThread[(+)&,{x,y}]];
2
(w21(w1#1+w2#2+b1)+b21-#1)
2
(w22(w1#1+w2#2+b1)+b22-#2)
In[]:=
sol=NMinimize[G,{w1,w2,w21,w22,b1,b2,b21,b22}]
Out[]=
{0.0449736,{w1-0.457826,w2-0.920997,w21-0.432794,w22-0.870639,b10.235551,b20.0457489,b210.108177,b220.201982}}
In[]:=
{W1,W2,W21,W22,B1,B2,B21,B22}={w1,w2,w21,w22,b1,b2,b21,b22}/.sol[[2]];
In[]:=
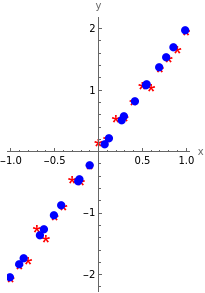
encoding=Map[W1#[[1]]+W2#[[2]]+B1&,vectors];
In[]:=
decoding=Map[{W21#+B21,W22#+B22}&,encoding];
In[]:=
p1=ListPlot[decoding,PlotStyleBlue,PlotMarkers{"●",Medium},AspectRatio1.5];
In[]:=
Show[{p0,p1}]
Out[]=
In[]:=
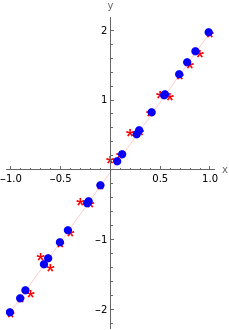
b=Fit[vectors,{1,a},a]
Out[]=
-0.0156339+1.99992a
In[]:=
Show[{p0,p1,Plot[b,{a,-1,1},PlotStyle{Thin,Red}]}]
Out[]=
1.6.2 Simple Example
1.6.2 Simple Example
In[]:=
vectors
Out[]=
{{-1.,-2.05099},{-0.9,-1.84079},{-0.8,-1.75689},{-0.7,-1.23233},{-0.6,-1.39337},{-0.5,-1.04112},{-0.4,-0.886743},{-0.3,-0.44876},{-0.2,-0.465643},{-0.1,-0.217627},{0.,0.158387},{0.1,0.230165},{0.2,0.544661},{0.3,0.561099},{0.4,0.826308},{0.5,1.0922},{0.6,1.06042},{0.7,1.36763},{0.8,1.52448},{0.9,1.67915},{1.,1.96145}}
In[]:=
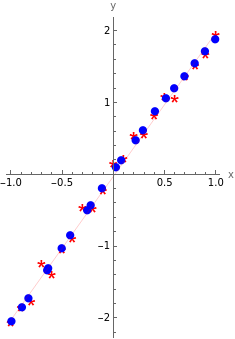
autoencoder=DimensionReduction[vectors,1,Method"AutoEncoder",TargetDevice"GPU"]
Out[]=
DimensionReducerFunction

In[]:=
reduced=autoencoder[vectors]
Out[]=
{{-2.078},{-1.90695},{-1.80033},{-1.4689},{-1.48725},{-1.24373},{-1.10116},{-0.813898},{-0.758696},{-0.568352},{-0.335328},{-0.287479},{-0.155278},{-0.0895063},{0.0317103},{0.153078},{0.241743},{0.35306},{0.46347},{0.573868},{0.685034}}
In[]:=
reconstructed=autoencoder[reduced,"OriginalVectors"]
Out[]=
{{-0.994922,-2.05195},{-0.891983,-1.85088},{-0.827824,-1.72555},{-0.634903,-1.3143},{-0.645579,-1.33705},{-0.503829,-1.03488},{-0.420839,-0.857975},{-0.253629,-0.501532},{-0.221497,-0.433036},{-0.1107,-0.196848},{0.0269367,0.0957477},{0.0781201,0.195443},{0.219536,0.470892},{0.289891,0.607931},{0.406282,0.874479},{0.513447,1.06077},{0.593787,1.19658},{0.694651,1.36709},{0.794694,1.53622},{0.894725,1.70532},{0.995453,1.8756}}
In[]:=
p1=ListPlot[reconstructed,PlotStyleBlue,PlotMarkers{"●",Medium},AspectRatio1.5];
In[]:=
Show[{p0,p1,Plot[b,{a,-1,1},PlotStyle{Thin,Red}]}]
Out[]=
1.6.3 Simple Example
1.6.3 Simple Example
In[]:=
img=ImageResize
,{160,160}

Out[]=

In[]:=
data=ImageData[img];data//Dimensions
Out[]=
{160,160,3}
In[]:=
data[[1,1]]
Out[]=
{0.356863,0.298039,0.14902}
In[]:=
vector=Flatten[data,1];
In[]:=
Dimensions[vector]