3.1 KMeans Clustering
3.1 KMeans Clustering
3.1.1 Small Data Set
3.1.1 Small Data Set
In[]:=
session=StartExternalSession["Python"]
Out[]=
ExternalSessionObject

Test
In[]:=
5+6
Out[]=
11
In[]:=
from numpy import array, matrix
from scipy.io import mmread, mmwrite
import numpy as np
from numpy import array, matrix
from scipy.io import mmread, mmwrite
import numpy as np
In[]:=
from sklearn.datasets import make_blobs
from sklearn.cluster import KMeans
from sklearn.cluster import KMeans
In[]:=
X, y = make_blobs(random_state=1)
kmeans = KMeans(n_clusters=3).fit(X)
pre= kmeans.predict(X)
pred=np.array([pre])
kmeans = KMeans(n_clusters=3).fit(X)
pre= kmeans.predict(X)
pred=np.array([pre])
In[]:=
mmwrite('labels.mtx',pred)
mmwrite('dataX',X)
mmwrite('dataX',X)
In[]:=
cent= kmeans.cluster_centers_
cent
cent
Out[]=
NumericArray
In[]:=
Normal[%]
Out[]=
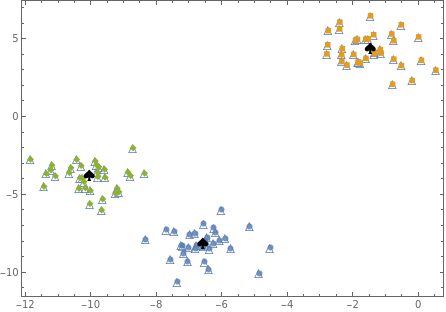
{{-6.58197,-8.17239},{-1.47108,4.33722},{-10.0494,-3.85954}}
In[]:=
centers=%;
In[]:=
labels=Import["labels.mtx"]//Flatten;
In[]:=
datap=Import["dataX.mtx"];
In[]:=
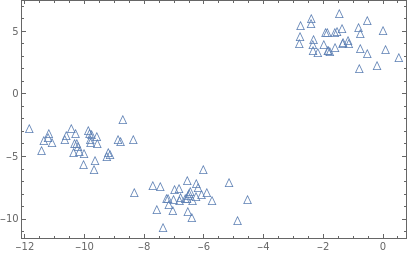
p0=ListPlot[datap,Frame->True,PlotMarkers"",AxesNone]
Out[]=
In[]:=
dataC=MapThread[Flatten[{#1,#2}]&,{datap,labels}];
In[]:=
dataC1=Map[{#[[1]],#[[2]]}&,Select[dataC,#[[3]]0&]];
In[]:=
dataC2=Map[{#[[1]],#[[2]]}&,Select[dataC,#[[3]]1&]];
In[]:=
dataC3=Map[{#[[1]],#[[2]]}&,Select[dataC,#[[3]]2&]];
In[]:=
Show[{p0,ListPlot[{dataC1,dataC2,dataC3},Frame->True,PlotMarkersAutomatic,AxesNone],ListPlot[centers,PlotMarkers"♠",PlotStyle{Black,Large}]},AspectRatio0.7]
Out[]=
In[]:=
from sklearn import metrics
s=metrics.silhouette_score(X,pre,'euclidean')
s
s=metrics.silhouette_score(X,pre,'euclidean')
s
Out[]=
0.769709
In[]:=
clusters=FindClusters[datap,3,Method"KMeans",PerformanceGoal"Quality"];
In[]:=
centers=Map[Mean[#]&,clusters]
Out[]=
{{-1.47108,4.33722},{-10.0494,-3.85954},{-6.58197,-8.17239}}
In[]:=
Show[{p0,ListPlot[clusters,Frame->True,PlotMarkersAutomatic,AxesNone],ListPlot[centers,PlotMarkers"♠",PlotStyle{Black,Large}]},AspectRatio0.7]
Out[]=
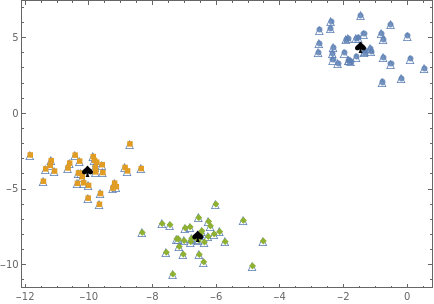
3.1.3 The result of the clustering with the centers of the clusters using Mathematica
In[]:=
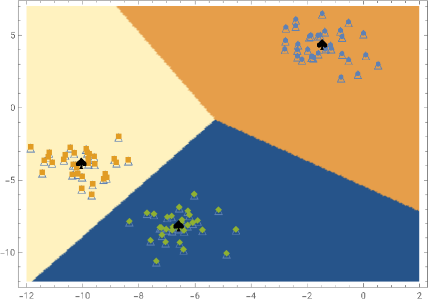
clustersF=ClusterClassify[datap,3,Method"KMeans",PerformanceGoal"Quality"]
Out[]=
ClassifierFunction
In[]:=
clustersF[{-6,-8},"Probabilities"]//Normal
Out[]=
{11.,23.92839×,34.92367×}
-36
10
-10
10
In[]:=
clustersF[{-5,-1},"Probabilities"]//Normal
Out[]=
{10.305066,20.665971,30.0289628}
In[]:=
pD=DensityPlot[clustersF[{x,y}],{x,-12,2},{y,-12,7},PlotPoints100];
In[]:=
Show[{pD,p0,ListPlot[clusters,Frame->True,PlotMarkersAutomatic,AxesNone],ListPlot[centers,PlotMarkers"♠",PlotStyle{Black,Large}]},AspectRatio0.7]
Out[]=
In[]:=
index=Map[#-1&,ClusteringComponents[datap,3,1,Method->"KMeans",PerformanceGoal"Quality"]]
Out[]=
{0,1,1,1,2,2,2,1,0,0,1,1,2,0,2,2,2,0,1,1,2,1,2,0,1,2,2,0,0,2,0,0,2,0,1,2,1,1,1,2,2,1,0,1,1,2,0,0,0,0,1,2,2,2,0,2,1,1,0,0,1,2,2,1,1,2,0,2,0,1,1,1,2,0,0,1,2,2,0,1,0,1,1,2,0,0,0,0,1,0,2,0,0,1,1,2,2,0,2,0}
In[]:=
Export["pred.mtx",{index}]
Out[]=
pred.mtx
In[]:=
index=mmread('pred.mtx')
In[]:=
ind=index[0]
from sklearn import metrics
s=metrics.silhouette_score(X,ind,'euclidean')
s
from sklearn import metrics
s=metrics.silhouette_score(X,ind,'euclidean')
s
In[]:=
index=mmread('pred.mtx')
In[]:=
ind=index[0]
s=metrics.silhouette_score(X,ind,'euclidean')
s
s=metrics.silhouette_score(X,ind,'euclidean')
s
3.1.2 Clustering Images
3.1.2 Clustering Images
In[]:=
X=mmread('dataX.mtx')
In[]:=
import numpy as np
In[]:=
kmeans = KMeans(n_clusters=3).fit(X)
prediction= kmeans.predict(X)
prediction
prediction= kmeans.predict(X)
prediction
In[]:=
cent= kmeans.cluster_centers_
cent
cent
In[]:=
from sklearn import metrics
s=metrics.silhouette_score(X,prediction,'euclidean')
s
s=metrics.silhouette_score(X,prediction,'euclidean')
s