1.5 Radial Basis Function
1.5 Radial Basis Function
1.5.1 RBF Approximation
1.5.1 RBF Approximation
In[]:=
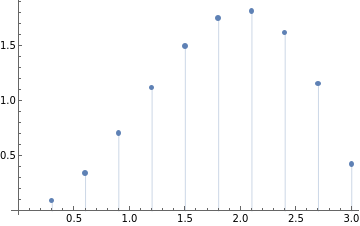
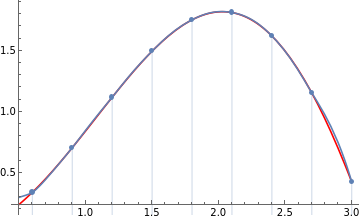
data=Table[{i0.3,i0.3Sin[i0.3]},{i,1,10}]
Out[]=
{{0.3,0.0886561},{0.6,0.338785},{0.9,0.704994},{1.2,1.11845},{1.5,1.49624},{1.8,1.75293},{2.1,1.81274},{2.4,1.62111},{2.7,1.15393},{3.,0.42336}}
In[]:=
p1=ListPlot[data,FillingAxis]
Out[]=
In[]:=
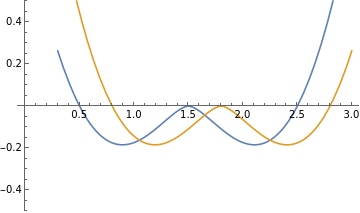
TPSpline=Function[{x,xi},If[x≠xi,Log[Abs[x-xi]],{0}]]
2
Abs[{x-xi}]
Out[]=
Function[{x,xi},If[x≠xi,Log[Abs[x-xi]],{0}]]
2
Abs[{x-xi}]
In[]:=
Plot[{TPSpline[x,1.5],TPSpline[x,1.8]},{x,0.3,3},PlotRange{-0.5,0.5}]
Out[]=
In[]:=
np=Length[data];datax=Transpose[data][[1]];
In[]:=
datay=Transpose[data][[2]];
In[]:=
M=Table[First[TPSpline[datax[[i]],datax[[j]]]],{i,1,np},{j,1,np}];
In[]:=
Norm[Inverse[M]]Norm[M]
Out[]=
308.843
In[]:=
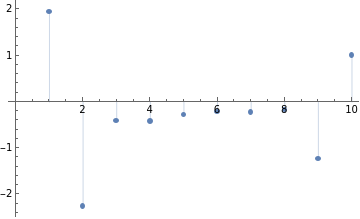
c=PseudoInverse[M].datay
Out[]=
{1.94971,-2.26345,-0.412961,-0.419176,-0.282941,-0.22277,-0.224389,-0.178729,-1.23521,1.00129}
In[]:=
ListPlot[c,FillingAxis]
Out[]=
In[]:=
g[x_]:=First[c.Map[TPSpline[x,#]&,datax]]
In[]:=
Show[{Plot[xSin[x],{x,0.5,3},PlotStyleRed],Plot[g[x],{x,0.5,3},PlotRange{0,3}],p1}]
Out[]=
1.5.2 RBF Image Compression
1.5.2 RBF Image Compression
In[]:=
image=
;

In[]:=
img=ColorConvert[image,"Grayscale"];
In[]:=
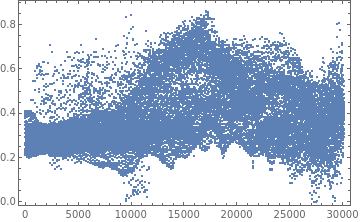
M=ImageData[img];M//Dimensions
Out[]=
{173,174}
In[]:=
ListPlot[Flatten[M],PlotStylePointSize[Tiny],FrameTrue]
Out[]=
In[]:=
MR=M;
In[]:=
SeedRandom[4567]
In[]:=
Do[MR[[RandomInteger[{1,173}],RandomInteger[{1,174}]]]=1.,{i,1,60000}];
In[]:=
Image[MR]
Out[]=
In[]:=
dataz={};dataxy={};
In[]:=
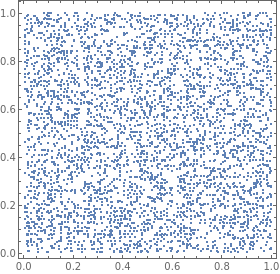
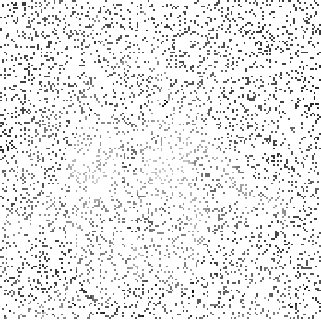
Do[If[MR[[i,j]]≠1.,AppendTo[dataxy,{i/173.,j/174.}];AppendTo[dataz,MR[[i,j]]]],{i,1,173},{j,1,174}]
In[]:=
ListPlot[dataxy,FrameTrue,AspectRatio1,PlotStylePointSize[Tiny]]
Out[]=