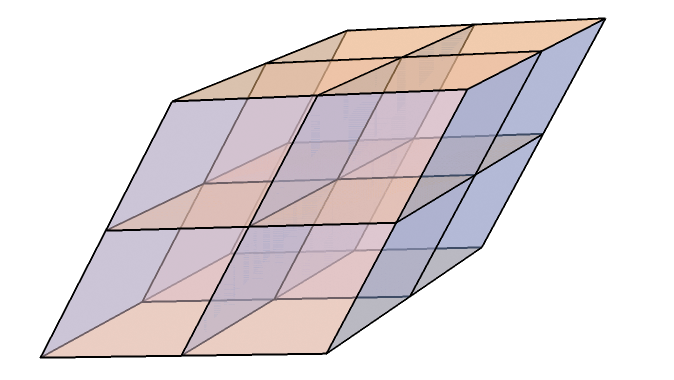
plots cells of the lattice defined by the basis vectors vi with ni cells plotted along each basis direction.
Details and Options
The ni are natural numbers specifying the number of unit cells to be drawn along each of the basis vector directions vi.
The following options are supported:
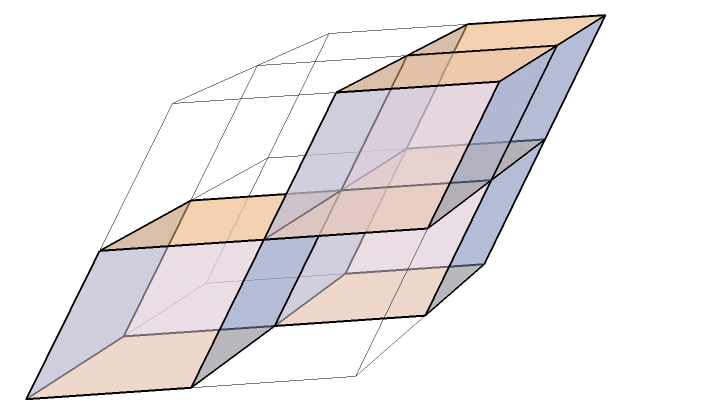
"PositionCell"
0
list of indices specifying which unit cells to plot (highlight)
"BackgroundCell"
"UnitCellEdge"
specifies how the remaining lattice points or unit cells (which are not highlighted) should appear
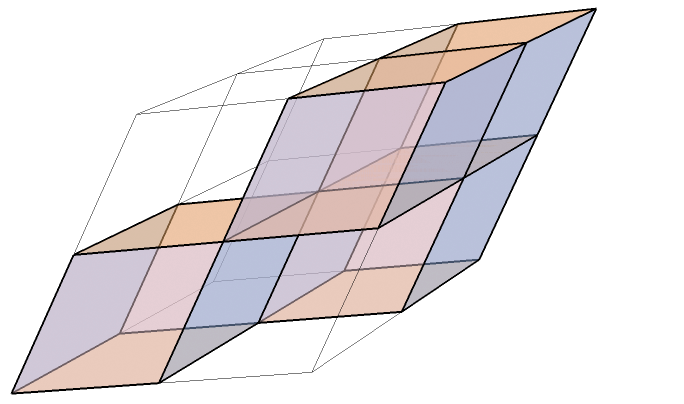
"PositionCell" is an option that is a list of indices specifying which unit cells to plot (highlight). The default is to highlight all the unit cells. It is a list having the same dimensions as {nx,ny,nz}, and the elements are either 0 or 1. The positions (indices) containing 1 are the unit cells that would be highlighted.
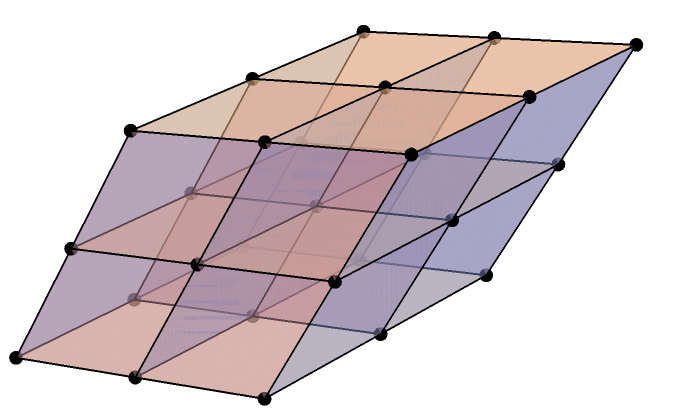
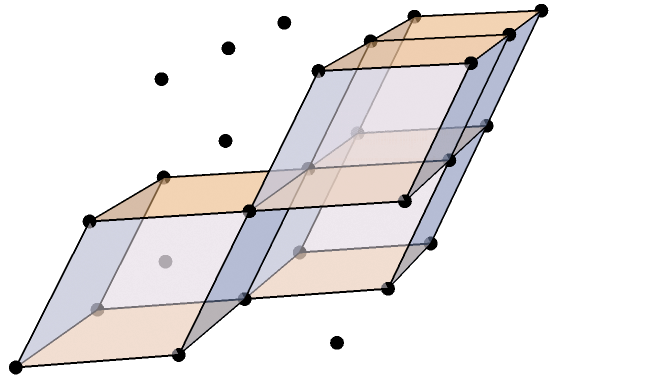
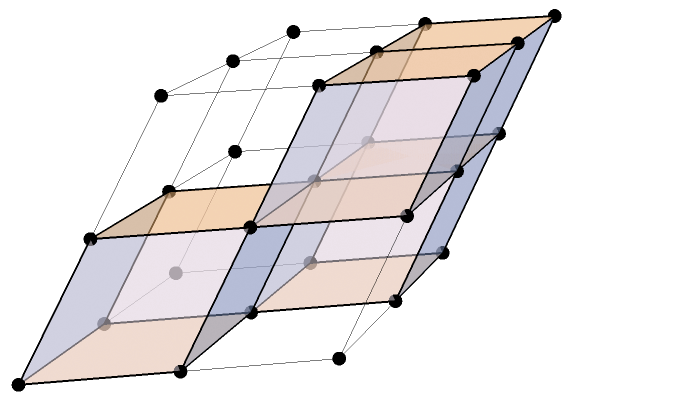
"BackgroundCell" is an option that specifies how the remaining lattice points or unit cells (which are not highlighted) should appear. The default value is "UnitCellEdge." It takes the following values:
"LatticePoints"
plot only lattice points
"UnitCellEdge"
plot only the edges of the unit cells
"PointsAndCell"
plot the lattice points as well as the edges of the unit cells