In[]:=
Take[{1,1,2,4,11,27,83,255,847,2829,9734,33724,118245,416816,1478602,5267171,18840144,67611472,243378415,878407170,3178068821,11523323634,41865833602,152382134767},14]
Out[]=
{1,1,2,4,11,27,83,255,847,2829,9734,33724,118245,416816}
In[]:=
Take[ResourceData["Polyform Database"]["polyomino 2-sided"]["PolyformCounts"],14]
Out[]=
{1,1,2,5,12,35,108,369,1285,4655,17073,63600,238591,901971}
In[]:=
%-%%
Out[]=
{0,0,0,1,1,8,25,114,438,1826,7339,29876,120346,485155}
In[]:=
Length[{1,1,2,4,11,27,83,255,847,2829,9734,33724,118245,416816,1478602,5267171,18840144,67611472,243378415,878407170,3178068821,11523323634,41865833602,152382134767}]
Out[]=
24
In[]:=
Take[ResourceData["Polyform Database"]["polyomino 2-sided"]["PolyformCounts"],24]/{1,1,2,4,11,27,83,255,847,2829,9734,33724,118245,416816,1478602,5267171,18840144,67611472,243378415,878407170,3178068821,11523323634,41865833602,152382134767}
Out[]=
1,1,1,,,,,,,,,,,,,,,,,,,,,
5
4
12
11
35
27
108
83
123
85
1285
847
4655
2829
17073
9734
15900
8431
238591
118245
901971
416816
1713288
739301
1868465
752453
50107909
18840144
48155513
16902868
106089176
34768345
95689065
29280239
11123060678
3178068821
7198642948
1920553939
84023503864
20932916801
654999700403
152382134767
In[]:=
N[%]
Out[]=
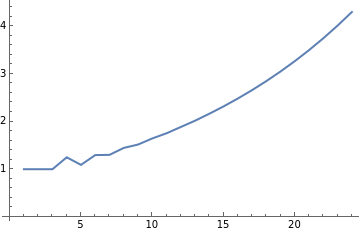
{1.,1.,1.,1.25,1.09091,1.2963,1.3012,1.44706,1.51712,1.64546,1.75396,1.8859,2.01777,2.16395,2.31744,2.48317,2.65964,2.84896,3.05132,3.26804,3.49994,3.74821,4.01394,4.2984}
In[]:=
ListLinePlot[%]
Out[]=
In[]:=
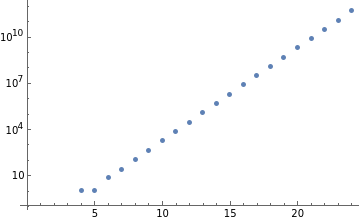
ListLogPlot[%]
Out[]=
In[]:=
Ratios[%239]

0
0
0
0
1
0
Out[]=
Indeterminate,Indeterminate,ComplexInfinity,1,8,,,,,,,,,,,,,,,,,,
25
8
114
25
73
19
913
219
7339
1826
29876
7339
60173
14938
485155
120346
1947974
485155
558006
139141
31267765
7812084
25002116
6253553
499245817
125010580
1992264780
499245817
240757329
60371660
3518726006
882776873
63090587063
15834267027
251308782818
63090587063
In[]:=
%//N
Out[]=
{Indeterminate,Indeterminate,ComplexInfinity,1.,8.,3.125,4.56,3.84211,4.16895,4.01917,4.07085,4.02818,4.03133,4.01516,4.01036,4.00249,3.99807,3.99363,3.99055,3.98792,3.98597,3.98443,3.9833}
In[]:=
%-%%
Out[]=
{-23,-23,-22,-19,-12,11,84,345,1261,4631,17049,63576,238567,901947,3426552,13079231,50107885,192622028,742624208,2870671926,11123060654,43191857664,168047007704,654999700379}
In[]:=
SeedRandom[435646];AggregationArrayPlot[{1}][Last[RandomTotalisticAggregation[{{1},Join[IdentityMatrix[2],-IdentityMatrix[2]]},Position[CrossMatrix[{1,1}],1]-2,500]],"Boundary"->True,Padding->1]
Out[]=

In[]:=
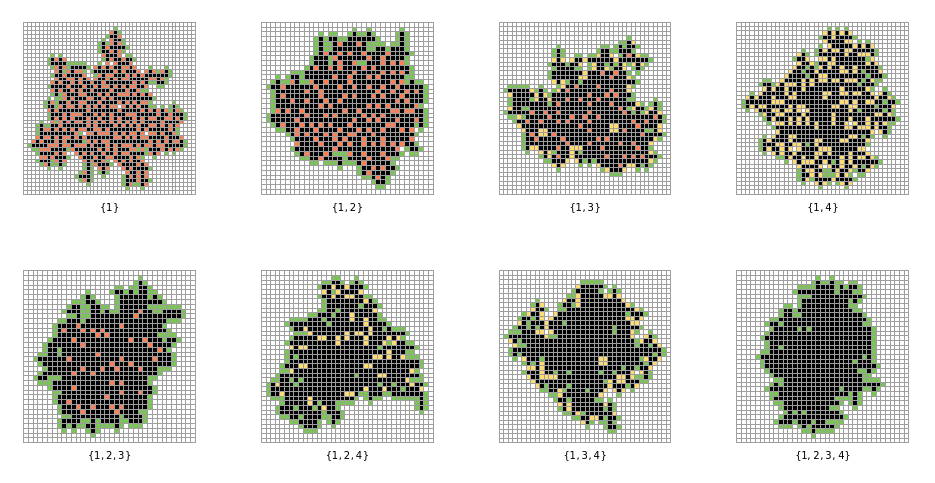
GraphicsGrid[Partition[Labeled[(SeedRandom[435646];AggregationArrayPlot[#][Last[RandomTotalisticAggregation[{#,Join[IdentityMatrix[2],-IdentityMatrix[2]]},Position[CrossMatrix[{1,1}],1]-2,500]],"Boundary"->True,Padding->1]),Text[#]]&/@Select[Subsets[Range[4]],MemberQ[1]],4]]
Out[]=
In[]:=
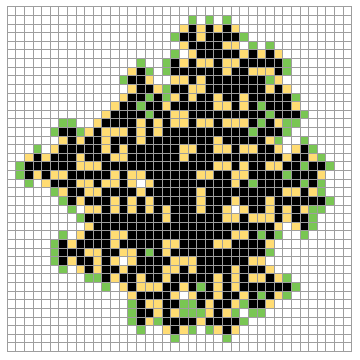
(SeedRandom[435646];AggregationArrayPlot[#][Last[RandomTotalisticAggregation[{#,Join[IdentityMatrix[2],-IdentityMatrix[2]]},Position[CrossMatrix[{1,1}],1]-2,500]],"Boundary"->True,Padding->1])&@{1,4}
Out[]=
In[]:=
Labeled[With[{ru=#},Graph[AddVertexArrayPlots[ru][TotalisticAggregationMultiwayGraph[{ru,Join[IdentityMatrix[2],-IdentityMatrix[2]]},{{0,0}},4,"Canonicalize"->True]],AspectRatio->1/2,VertexSize->1,ImageSize->500,GraphLayout->"LayeredDigraphEmbedding"]],Text[#]]&/@Select[Subsets[Range[4]],MemberQ[1]]
Graph
Graph
Random Evolution
Random Evolution
Want to show the aging of the cells....
{2} case
{2} case