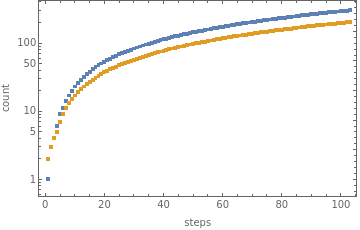
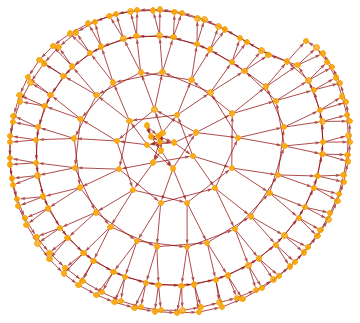
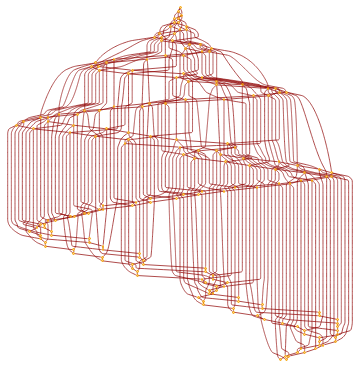
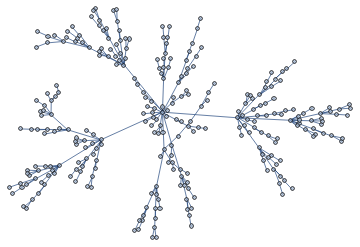
90 steps
wm78525wm78525
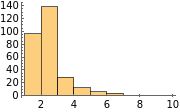
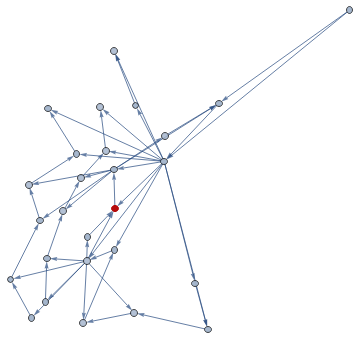
signature
23→33
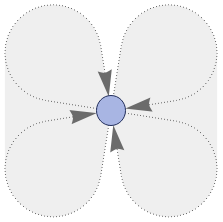
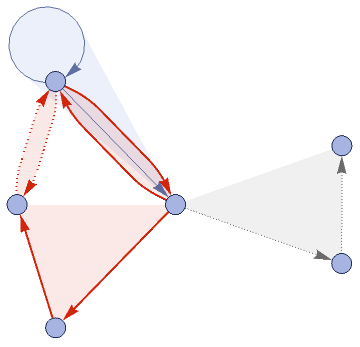
rule

{{{1, 2, 1}, {3, 4, 5}} -> {{2, 6, 2}, {5, 7, 6}, {3, 1, 5}}}
{{{1, 2, 1}, {3, 4, 5}} -> {{2, 6, 2}, {5, 7, 6}, {3, 1, 5}}}
 make editable copy
 download notebook