In[]:=
Fri 3 Jan 2025 10:45:41
Visualize repelling behavior of eigenvalues
Visualize repelling behavior of eigenvalues
Eigenvalues of matrices don’t like to be next to each other. Similar behavior underlies behavior of primes, energy levels and tree rings, see https://www.americanscientist.org/article/the-spectrum-of-riemannium
Below is a simple visualization of repelling behavior -- take a random matrix, and visualize what happens with eigenvalues as we rotate this matrix.
Below is a simple visualization of repelling behavior -- take a random matrix, and visualize what happens with eigenvalues as we rotate this matrix.
In[]:=
d=20;SeedRandom[1];mat=RandomVariate[NormalDistribution[],{d,d}]
d
+.1IdentityMatrix[d]I;rotate[theta_]:=(blocks=Table[R[i]->RotationMatrix[theta],{i,d/2}];mat.ArrayFlatten[DiagonalMatrix[Array[R,d/2]]/.blocks]);Animate[ComplexListPlot[Eigenvalues[rotate[p]],Axes->None,PlotRange->{-1-I,1+I}],{p,0,2Pi},SaveDefinitions->True]Out[]=
We can visualize the trajectories
In[]:=
d=20;evals=Table[Eigenvalues[rotate[p]],{p,0,2Pi,.001}];ListPlot[ReIm@Flatten@evals,PlotStyle->Directive[PointSize[.01],Opacity[.01]],PlotRange->{{-1,1},{-1,1}},AspectRatio->1,Axes->None]
Out[]=
Visualize trajectory
Visualize trajectory
Cleaned-up code
Cleaned-up code
In[]:=
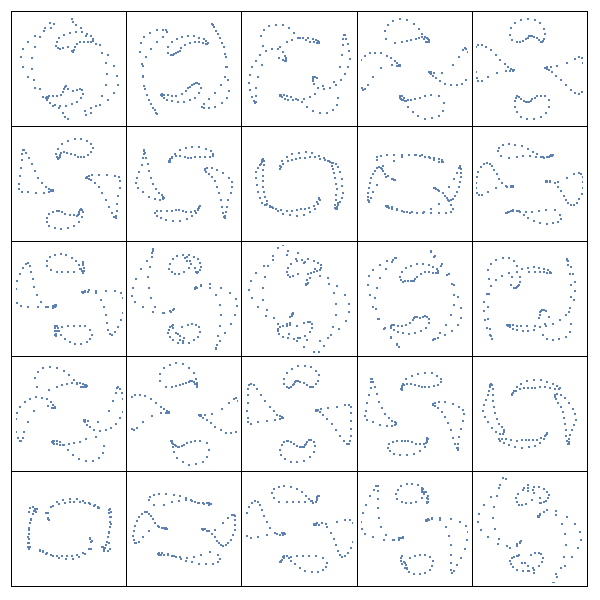
ClearAll["Global`*"];SeedRandom[1];d=4;(*dimensions*)numSteps=25;(*numberofrotationstepsperframe*)numFrames=25;(*numberofframes*)(*isoclinicrotationofthetainthebasisofP*)isoclinic[theta_,P_]:=Module[{simple,composite,R},simple=Table[R[i]->RotationMatrix[theta],{i,d/2}];composite=ArrayFlatten[DiagonalMatrix[Array[R,d/2]]/.simple];P.composite.P];(*listofeigenvaluesobtainedfromrotatinggivenmatrixinbasisP*)eigenTrajectory[mat_,P_]:=(Table[Eigenvalues[mat.isoclinic[theta,P]],{theta,0,2Pi,2Pi/numSteps}]);(*Randombasis*)P0=RandomVariate@CircularRealMatrixDistribution@d;(*randomcomplexmatrixwitheigenvaluesapproximatelyinunitcircle*)genMat:=RandomVariate[NormalDistribution[],{d,d}];mat=(genMat+IgenMat)
2d
;plot[vals_]:=ComplexListPlot[vals,PlotRange->1.2*{-1-I,1+I},Axes->None];pointFrames=plot/@eigenTrajectory[mat,IdentityMatrix[d]];GraphicsGrid[Partition[pointFrames,Sqrt[numSteps]],Frame->All]curveFrames=Table[plot[Flatten@eigenTrajectory[mat,isoclinic[theta,P0]]],{theta,0,2Pi,2Pi/numFrames}];GraphicsGrid[Partition[curveFrames,Sqrt[numFrames]],Frame->All]Out[]=
Out[]=

