Exploration of Noble Gases
Exploration of Noble Gases
Noble gases are located in the far right of the periodic table. They possess great stability and rarely react with other elements. Under standard conditions, they are all odorless, colorless, and monatomic gases.
General properties of noble gases
General properties of noble gases
◼
Generate the list of noble gases:
In[112]:=
class=EntityClass["Element","NobleGas"]
Out[112]=
◼
Find their abbreviations:
In[113]:=
entities=class["Entity"];abbs=class["Abbreviation"];
In[115]:=
Thread[entitiesabbs]
Out[115]=
He,Ne,Ar,Kr,Xe,Rn,Og
◼
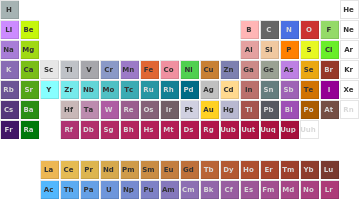
Locate them in white in the periodic table:
In[122]:=
ColorData["Atoms","Image"]/.Thread[class["IconColor"]White]
Out[122]=
We consider a subset of noble gases for our analysis.
◼
Construct a list of noble gases:
In[137]:=
noblegases=CanonicalName[entities][[1;;4]]
Out[137]=
{Helium,Neon,Argon,Krypton}
We analyze some of their properties:
◼
Extract data using the Wolfram Language symbol ThermodynamicData:
In[140]:=
properties=DeleteMissing[ThermodynamicData[#]]&/@noblegases;
◼
Construct an array of properties:
In[179]:=
data=Transpose[Join[{Keys[properties]〚1〛},Values/@properties]];
◼
Display these properties in a grid:
In[173]:=
Grid[Prepend[data〚1;;6〛,data〚20〛],FrameAll]
Out[173]=
Name | helium | neon | argon | krypton |
CriticalDensity | ||||
CriticalEnthalpy | ||||
CriticalEntropy | ||||
CriticalInternalEnergy | ||||
CriticalPressure | ||||
CriticalTemperature |
In[174]:=
Grid[Prepend[data〚7;;12〛,data〚20〛],FrameAll]
Out[174]=
Name | helium | neon | argon | krypton |
Density | ||||
Enthalpy | ||||
Entropy | ||||
InternalEnergy | ||||
IsobaricHeatCapacity | ||||
IsochoricHeatCapacity |
In[175]:=
Grid[Prepend[data〚13;;19〛,data〚20〛],FrameAll]
Out[175]=
Name | helium | neon | argon | krypton |
MolarDensity | ||||
MolarEnthalpy | ||||
MolarEntropy | ||||
MolarInternalEnergy | ||||
MolarIsobaricHeatCapacity | ||||
MolarIsochoricHeatCapacity | ||||
MolarSpecificVolume |
In[176]:=
Grid[Prepend[data〚22;;25〛,data〚20〛],FrameAll]
Out[176]=
Name | helium | neon | argon | krypton |
SoundSpeed | ||||
SpecificVolume | ||||
ThermalConductivity | ||||
TriplePointGasDensity |
In[177]:=
Grid[Prepend[data〚26;;All〛,data〚20〛],FrameAll]
Out[177]=
Name | helium | neon | argon | krypton |
TriplePointLiquidDensity | ||||
TriplePointPressure | ||||
TriplePointTemperature | ||||
Viscosity |
Analysing density functions
Analysing density functions
Let us analyse the density of the noble gases with respect to pressure and temperature.
◼
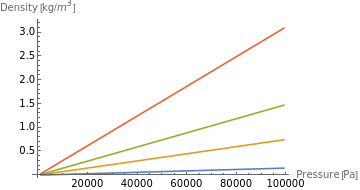
Construct the density data for a constant temperature of 50°C:
In[211]:=
densitydata=Transpose[{Quantity[1000Range[1,100,2],"Pascals"],ThermodynamicData[#,"Density",{"Temperature"Quantity[50,"DegreesCelsius"],"Pressure"Quantity[Range[1,100,2]1000,"Pascals"]}]}]&/@noblegases;
◼
Plot the density function:
In[235]:=
ListLinePlot[densitydata,AxesLabel{"Pressure [Pa]","Density [kg/]"},PlotLegendsnoblegases]
3
m
Out[235]=
Let us do the same with a constant atmospheric pressure.
◼
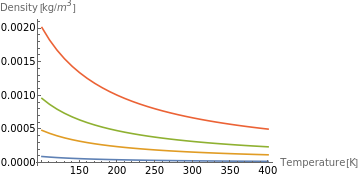
Construct the density data for a constant pressure of 20 Pa:
In[213]:=
densitydata2=Transpose[{Quantity[Range[100,400,10],"Kelvins"],ThermodynamicData[#,"Density",{"Pressure"Quantity[20,"Pascals"],"Temperature"Quantity[Range[100,400,10],"Kelvins"]}]}]&/@noblegases;
◼
Plot the pressure function:
In[236]:=
ListLinePlot[densitydata2,AxesLabel{"Temperature [K]","Density [kg/]"},PlotLegendsnoblegases]
3
m
Out[236]=
The shapes of the density functions are similar. We can also see that they are continuous, which indicate that for the selected range of temperature, no phase transition happens.
Phase plotting
Phase plotting
Let us build the phase plots of each noble gas.
◼
Choose the pressure interval:
◼
Create a phase plot for each noble gas:
◼
Display these plots in a grid:
Phase plot analysing
Phase plot analysing
Let us analyse the vapor-liquid phase boundary.
◼
Construct the array of data near the vapor-liquid boundary with constant pressure:
◼
Construct the array of data near the vapor-liquid boundary with constant temperature:
◼
Display the data in a grid:
We can see discontinuities in the density functions for low temperatures. This is an indication of the process of vapor-liquid phase transition of the noble gases.
Further Explorations
Analysing of other kinds of gases like halogens
Analysing of other properties of substances
Authorship information
Andrey Krotkikh
6/21/2017
andrei.krotkih@gmail.com


