Markov Chains
Markov Chains
A Markov Chain, named for Andrey Markov (1856 - 1922), is a stochastic process which describes transitions over time from one state to another and has the property that the future is independent of the past, given the present.
Discrete Time Markov Chain (DTMC)
We begin with a set of states for our system.
◼
We define our state space to be 1, 2, 3:
In[1]:=
dtmc=DiscreteMarkovProcess[1,{{.2,.3,.5},{.7,.2,.1},{.3,.3,.4}}];s={1,2,3}
Out[1]=
{1,2,3}
Let’s take a look at the transition probability matrix for these states
◼
Make a matrix of probabilities where each row sums to 1:
In[2]:=
p={{0.2,0.3,0.5},{0.7,.2,.1},{0.3,.3,.4}};MatrixForm[p]
Out[2]//MatrixForm=
0.2 | 0.3 | 0.5 |
0.7 | 0.2 | 0.1 |
0.3 | 0.3 | 0.4 |
Each entry is the probability of entering state j from state i.
p
ij
◼
For this particular DTMC, notice that you can enter any state from any other state.
◼
Compute the probability of entering state 3 from state 2, which we do by picking out :
p
2,3
In[35]:=
p[[2,3]]
Out[35]=
0.1
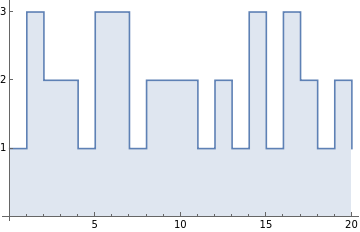
Now let’s simulate this system for 20 time steps
◼
We then make a plot of how the system evolved over time:
In[10]:=
data1=RandomFunction[dtmc,{0,20}]
Out[10]=
TemporalData
In[11]:=
ListLinePlot[data1,FillingAxis,Ticks{Automatic,{1,2,3}},InterpolationOrder0]
Out[11]=
Continuous Time Markov Chain (CTMC)
Rate Matrix for the CTMC
◼
Since the system is continuous, we no longer have steps as with the DTMC case. Consequentially, we now have a rate of going from one state to another instead of a probability.
In[12]:=
{{-6,6,0,0},{7,-13,6,0},{0,7,-13,6},{0,0,7,-7}}//MatrixFormctmc=ContinuousMarkovProcess[4,{{-6,6,0,0},{7,-13,6,0},{0,7,-13,6},{0,0,7,-7}}];
Out[12]//MatrixForm=
-6 | 6 | 0 | 0 |
7 | -13 | 6 | 0 |
0 | 7 | -13 | 6 |
0 | 0 | 7 | -7 |
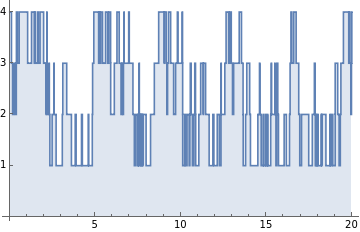
Now let’s simulate this system from t = 0 to 20.
◼
This gives us a plot where we can see that the system can change states at any time as opposed to the DTMC:
In[14]:=
data2=RandomFunction[ctmc,{0,20}]
Out[14]=
TemporalData
In[15]:=
ListLinePlot[data2,FillingAxis,Ticks{Automatic,{1,2,3,4}},InterpolationOrder0]
Out[15]=
Applications
Applications
To better visualize the DTMC, we use a transition diagram.
We can use the DTMC from earlier to make a weather model!
◼
The system is in state 1 when it’s raining, state 2 when it’s cloudy, and state 3 when it’s sunny out.
◼
The states are represented by nodes and the transition probabilities are the edges:
In[23]:=
Graph[dtmc,VertexLabels{1"rain",2"cloudy",3"sunny"},VertexStyle->{1->Blue,3->Yellow}]
Out[23]=
Given that it’s cloudy today, we can find the probability that it’ll be sunny in a week.
◼
We start in state 2 and want to see the probability we’ll be in state 3 in 10 time steps.
In[21]:=
Probability[sunny[10]2,sunnya]
Out[21]=
0.272727
What if we want to know the average long-run probability that it will be raining?
◼
We let t ∞ to find the pdf and choose rain (state 1) as our target state.
In[34]:=
N[PDF[dtmc[∞],1]]
Out[34]=
0.371901
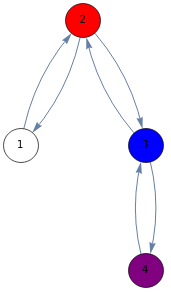
And here we have rate diagram for the CTMC
Furthermore, think of this system as having three machines. If all machines are running then the system is in state 4, if one machine is broken then the system is in state 3, if two machines are broken then the system is in state 2, and if all machines are broken then the system is in state 1. The machines break with arrival rate λ and are repaired with service rate μ. If we use the CTMC from earlier, our λ is 6/hr and our μ is 7/hr.
◼
The states are once again represented by nodes, but the transition rates are the edges now:
In[33]:=
Graph[ctmc,VertexLabels{1"both_up",2"m1_down",3"m2_down",4"both_up"},VertexStyle->{1->White,2Red,3Blue,4Purple}]
Out[33]=
If we start with all machines working, how long will it take until all three machines break?
◼
To compute this, we find the first passage time from state 4 to 1, where 1 is the target state.
In[18]:=
Mean[FirstPassageTimeDistribution[ctmc,1]]//N
Out[18]=
0.778426
This means that the system will take about .78 hours for the system to fail.
Further Explorations
We could investigate different birth/death queues like M/M/K/K or M/M/∞ since we only looked at an M/M/1 queue.
Additionally, we could explore networks of queues (e.g. Jackson Networks) and cost models of different queues types.
Christopher DeFiglia
2017/05/13
defigliacj@gmail.com