Measure of Center
Measure of Center
The center of a distribution is a typical value that represents the group. We will discuss how the shape of the distribution might influence whether the mean is larger than, smaller than, or about the same as the median.
Observations
Observations
Let’s take a look at the salaries from three university campuses.
◼
View the data:
In[189]:=
ResourceData["Sample Data: University Salaries"]
Out[189]=
We can see the salaries by department.
◼
Organize the data by department:
In[233]:=
data=GroupBy[ResourceData["Sample Data: University Salaries"],"Department"][All,All,"Salary"]
Out[233]=
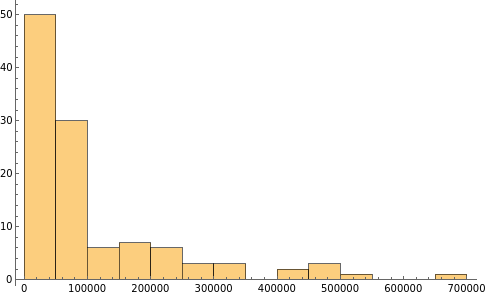
Let’s take a look at the distribution of the salaries of the Surgery department, which is #2 in the data.
◼
Make a histogram of 112 salaries of the Surgery department in the data:
In[69]:=
d=2;hist=Histogram[data[[d]]]
Out[70]=
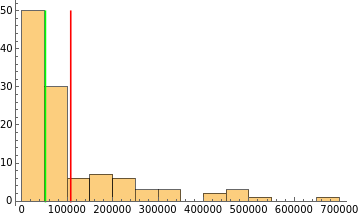
The shape of the salaries distribution of the Surgery department is skew-right. The mean of the salaries of the Surgery department is affected by the outlier $650,000 per year.
◼
This finds the mean of the salaries:
In[71]:=
mean=QuantityMagnitude[Mean[data[[d]]]]
Out[71]=
106748.
Is this a good estimate of the center of this distribution? Let’s take a look at the median.
◼
This finds the median of the salaries:
In[72]:=
median=QuantityMagnitude[Median[data[[d]]]]
Out[72]=
51038.2
Which one is a better estimate of the center of this distribution?
◼
Show the histogram, mean, and median together:
In[73]:=
Show[hist,ContourPlot[{xmean},{x,mean-1,mean+1},{y,0,50},ContourStyleRed,ColorFunctionAutomatic,FrameFalse,AxesTrue],ContourPlot[{xmedian},{x,median-1,median+1},{y,0,50},ContourStyleGreen,ColorFunctionAutomatic,FrameFalse,AxesTrue]]
Out[73]=
Deciding Which Measurements to Use
Skewed-Right Distributions
We now have a choice between two measurements of center and spread. We can use the median with the interquartile range, or we can use the mean with the standard deviation. Our next examples show that the shape of the distribution and the presence of outliers helps us to decide which measurements to use.
◼
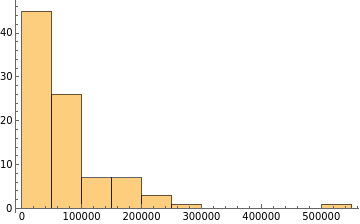
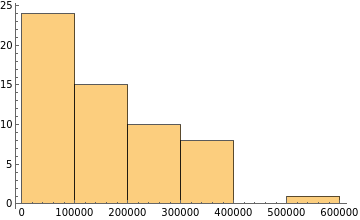
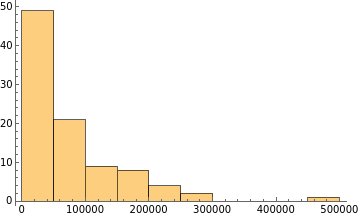
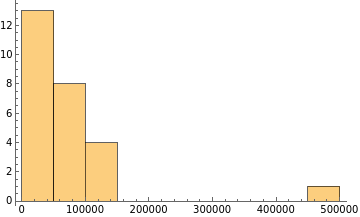
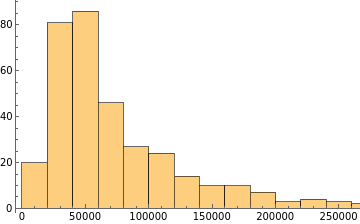
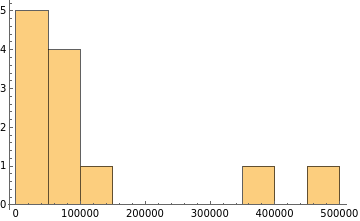
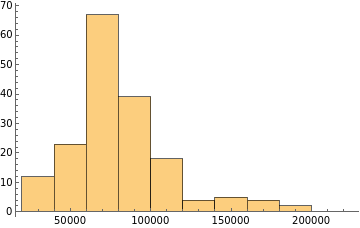
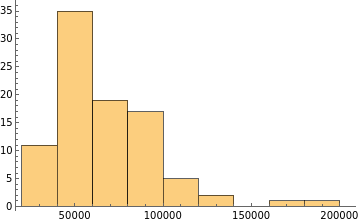
Here are the salaries distributions for the first 10 departments:
In[101]:=
Table[Histogram[data[[i]]],{i,10}]
Out[101]=
,
,
,
,
,
,
,
,
,
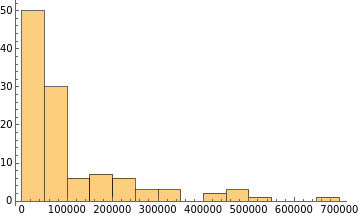
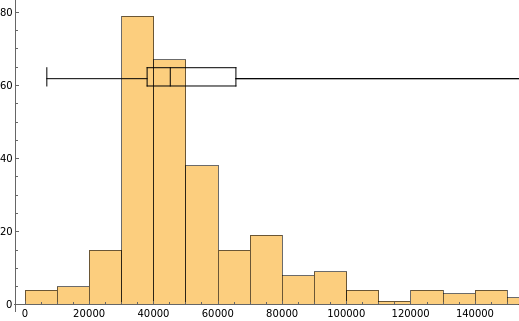
We see that the median represents the typical income of people in this sample better than the mean. The small number of people with higher incomes does not impact the median or the other quartile marks, so the first and third quartile marks give a range of incomes that more accurately represent typical incomes in the sample.
◼
Let’s take a look at the first histogram, except this time we overlay a boxplot:
Out[239]=
Skewed-Left Distributions
We take a look at the test scores of two exams given by a easy grader and a tough grader.
◼
Combine the boxplot and histogram of the scores in one plot:
In a skewed distribution, the upper half and the lower half of the data have a different amount of spread, so no single number such as the standard deviation could describe the spread very well. We get a better understanding of how the values are distributed if we use the quartiles and the two extreme values in the five-number summary.
Symmetric Distributions
Use the mean and the standard deviation as measures of center and spread only for distributions that are reasonably symmetric with a central peak.
◼
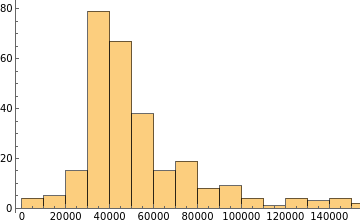
The distribution of baby weight is reasonably symmetric with a central peak. It has a mean of 7.78 lb with standard deviation of 0.66 lb:
When outliers are present, the mean and standard deviation are not a good choice.
◼
When there are premature babies present in the above data set:
Summary
Summary
Use the mean as a measure of center only for distributions that are reasonably symmetric with a central peak. When outliers are present, the mean is not a good choice.
Use the median as a measure of center for all other cases.
◼
Here is a manipulation to illustrate this guideline:
Exercises
Exercises
In many practical situations we are interested in measuring how many times a certain event occurs in a specific time interval or in a specific length or area. For instance: the number of texts students received during class in an hour.
◼
What is a better measure of the center of this distribution, mean or median?
What if we are not given the histogram of the distribution?
◼
How do we decide the better measure of center?
ListPlot[ResourceData["Sample Data: Boston Homes"][All, {"AGE", "NOX"}]]
Further Explorations
Investigate the website datarepository.wolframcloud.com and explain your choice of measure of center for a dataset that you are interested in.
Initialization
Initialization
Authorship information
Jie Frye
June 20, 2017
jiefrye@gmail.com