Sandpile Model for Self-Organized Criticality
Sandpile Model for Self-Organized Criticality
The sandpile model or Bak-Tang-Wiesenfeld sandpile was developed to demonstrate how a simple system can bring itself to a critical state without the need of careful tuning.
Setting Up the Model
Setting Up the Model
Our model involves placing sand on a table and adding grains one by one as we observe collapses. Let’s start by making our table.
◼
We begin by picking our table size:
In[56]:=
gridSize:=8
◼
Now let’s generate a matrix to represent our table:
In[57]:=
sandTable=Table[0,{i,1,gridSize},{j,1,gridSize}];ArrayPlot[sandTable,MeshTrue]
Out[58]=
Let’s seed the table with a blanket of sand that can be stacked 1 to 4 grains high in each cell.
◼
Let’s represent height with colors so blue corresponds to one grain, green to two grains, yellow to three grains, and red to four grains:
In[59]:=
heightColors={1.Blue,2.Green,3.Yellow,4.Red}
Out[59]=
1.,2.,3.,4.
◼
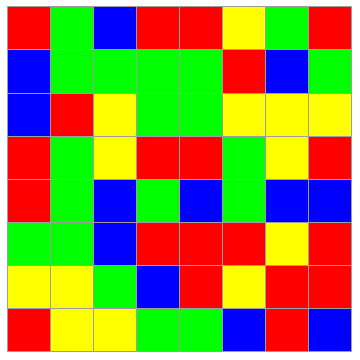
Now let’s blanket the table with sand at random heights:
In[60]:=
sandTable=Table[N@RandomInteger[{1,4}],{i,1,gridSize},{j,1,gridSize}];ArrayPlot[sandTable,ColorRulesheightColors,MeshTrue]
Out[61]=
Next we will place a grain of sand in a random cell on the table. If that cell gets taller than 4 grains of sand it will topple losing 4 grains and giving 1 grain to each neighbor that shares an edge.
◼
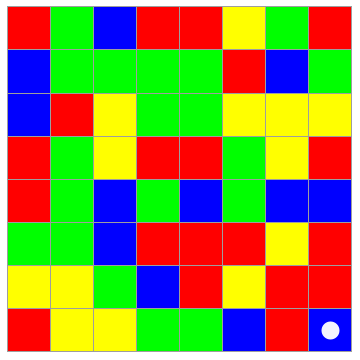
First we select a cell, we will distinguish this cell with a white dot:
In[62]:=
xy={RandomChoice[Range[1,gridSize]],RandomChoice[Range[1,gridSize]]}printArray:=ArrayPlot[sandTable,ColorRules->heightColors,MeshTrue,Epilog{White,Disk[{xy[[2]]-.5,gridSize-xy[[1]]+.5},.2]}]printArray
Out[62]=
{8,8}
Out[64]=
◼
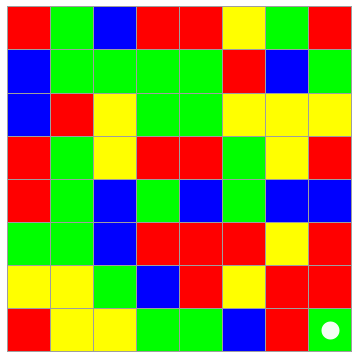
Now we will add a grain of sand to the cell we selected. If this made the cell larger than 5 grains tall then the cell will topple and cause an avalanche:
In[65]:=
addGrain[xy_List]:=sandTable=ReplacePart[sandTable,{xy[[1]],xy[[2]]}sandTable[[xy[[1]],xy[[2]]]]+1];addGrain[xy];printArray
Out[67]=
Avalanches and Moving Sand
Avalanches and Moving Sand
When a pile gets too tall it passes 1 grain to each neighbor that shares an edge.
◼
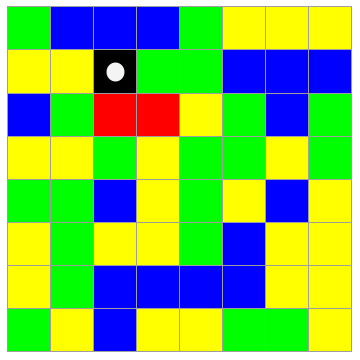
Here is a tower that is about to topple:
In[68]:=
sandTable=Table[N@RandomInteger[{1,3}],{i,1,gridSize},{j,1,gridSize}];xy={2,3};sandTable=ReplacePart[sandTable,{{xy[[1]],xy[[2]]}4.,{xy[[1]]+1,xy[[2]]}4.,{xy[[1]]+1,xy[[2]]+1}4.}];addGrain[xy];printArray
Out[72]=
◼
When a cell topples we remove 4 grains from that cell:
◼
Each cell effected by this avalanche is marked with a black dot:
If this transfer of sand makes a cell taller than four grains then that cell will also topple, continuing the avalanche.
◼
Here we define the avalanche sequence:
◼
Let’s see what happens as we let the avalanches die down in this trial:
Running the Model
Running the Model
Let’s call the whole process of adding a grain of sand and letting all avalanches die down a “step”.
◼
Let’s recap the process of taking a step:
◼
Now that we have encapsulated the process of taking a step, let’s take a whole bunch and watch what happens to the pile:
Analyzing the Data and Power Law Distribution
Analyzing the Data and Power Law Distribution
A power law distribution is when the size of an event is inversely proportional to the likelihood it will occur. So the bigger an event the less likely it will occur. Let’s see what behaviour our sandpile displayed.
◼
Let’s look at a histogram of our data. This displays the number of avalanches of each size. In this context size refers to how many cells toppled:
◼
It looks like some sort of power law distribution, let’s do some more analysis by counting how many of each avalanche size occurred:
◼
If we look at this on a Log-Log plot we should see a straight line, you may have to increase the neighbor of trials to improve the resolution of the graph:
◼
Let’s fit a line to the data and determine what α is:
◼
We should expect the slope to be close to -1. Let’s overlay the line we fit onto our data:
You may notice a slight bend towards the x-axis in the data. This is because our table has an edge which sand falls over. This edge places a limit on the maximum avalanche size.
1/f Noise
1/f Noise
1/f noise is when the signal frequency is inversely proportional to the power spectrum (the distribution of energy among frequency components, in our case energy is measured by avalanche size).
◼
Let’s look at the power spectrum of our data:
We can see the spectrum falls off quickly with frequency, notice the peak close to the y-axis.
So where is the criticality?
So where is the criticality?
If you were to experiment with different grid sizes (which you can!) you would find that the avalanches are scale-free. This means the only thing that distinguishes a small avalanche from a large one is the number of cells involved. It also means that running the experiment and linearly fitting the data would provide a similar α value. This scale-invariance is characteristic of critical systems.
◼
Try running the experiment with a larger table. This can be done by adjusting gridSize in the first code-block and re-evaluating the notebook.
Additionally, in critical systems the impact of small localized perturbation can be felt across the whole system. Meaning adding a single grain of sand can cause an avalanche which reshapes the entire landscape.
◼
Observe how adding a single grain of sand can reshape the landscape:
◼
Now take one step:
The criticality in this system lies in the angle of repose. If the sandpile slope was too shallow then an avalanche would do nothing but cause isolated changes. If the angle was too steep then the disruptions would always be large and felt across big portions of the system. At the critical angle the addition of a single grain of sand can do nothing, or reshape the landscape, and everything in between. This is only possible at the critical state, and this is the state we find the sandpile in. What is interesting about this system is that the critical state was achieved naturally without fine tuning external parameters, thus the system demonstrated self-organized criticality.
◼
Here is a subcritical sandpile, adding a grain of sand will only cause a small change in landscape:
◼
Here is a supercritical sandpile, adding a grain of sand will change the entire landscape:
Further Explorations
Find examples of large and small avalanches in the experiment.
Change the rules for how sand is distributed when a cell topples.
Investigate the topography of the sandpile landscape.
Increase the number of steps in the experiment.
Authorship information
Leo McElroy
2017/06/23
leomcelroy@gmail.com


