Resonance in a mechanical system
Resonance in a mechanical system
Mechanical systems are in resonance when a forcing frequency produced by or applied to a system matches a natural frequency of the system; this condition is important to understand as operating near or at resonance greatly magnifies the response of the system and this increased response can lead to noise, component failure, or other undesirable outcomes.
Air compressor system
Air compressor system
The sketch below shows an air compressor mounted on a beam; this is a realistic configuration as air compressors are sometimes mounted on ceiling beams in manufacturing plants or shop installations to save floor space.
Conceptual model
Conceptual model
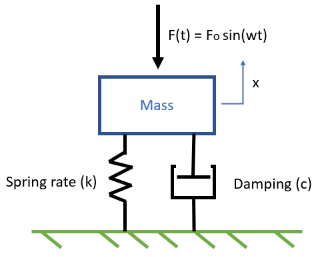
The conceptual model of the above air compressor system is shown below; the spring represents the vertical stiffness of the horizontal beam, the dash pot represents energy absorption in the system, the mass represents the effective mass of the air compressor, and the applied force represents a periodic force arising from imbalance in the motor/compressor system which is spinning at some frequency ω:
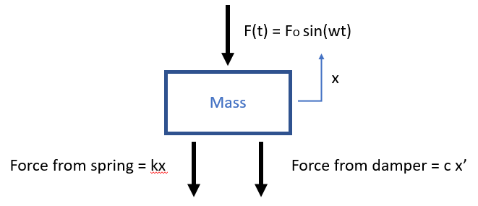
The free body diagram for this conceptual model is created by imagining the mass being displaced in the positive direction of the x coordinate system and drawing the forces on the mass that result from movement in this direction:
The free body diagram for this conceptual model is created by imagining the mass being displaced in the positive direction of the x coordinate system and drawing the forces on the mass that result from movement in this direction:
Newton’s 2nd law is applied by summing all forces acting on the mass and equating this summation to the mass times the acceleration; this yields the the Equation of Motion (EOM) for the system:
mx’’ + cx’ + kx = Fo sin(ωt) E(1)
The following sections demonstrate the solution to the above equation and allow exploration of this system using nondimensionalized parameters.
Solution to the homogeneous equation
Solution to the homogeneous equation
Before solving the 2nd order differential equation shown in E(1), though, it is important to understand the free vibration behaviour of the system. The EOM for this condition is found by setting F(t) = 0. This leads to the EOM for free vibration:
mx’’ + cx’ + kx = 0 E(2)
The solution to equation E(2) has three branches depending on the values of m, c, and k. By defining several parameters, the solution to E(2) can be greatly simplified. The necessary definitions are: circular natural frequency as ωn = critical damping as cc = 2 m ωn critical damping ratio ζ = c/cc damped natural frequency as ωd = ωn the frequency ratio r = ω/ωnWith the above definitions, the three branches of the solution to E(2) can be defined by three ranges of ζ:
k/m
1-
2
ζ
ζ > 1 equates to an overdamped system ζ = 1 equates to a critically damped system ζ < 1 equates to an underdamped system
Free vibration in an underdamped system
Free vibration in an underdamped system
The solution to equation E(2) when ζ is less than 1 is given by:
In[17]:=
xUnderDamped[t_,ζ_,ωn_,x0_,v0_]:=x0Cost;
-tζωn
1-
ωn+2
ζ
(v0+x0ζωn)Sint
1-
ωn2
ζ
1-
ωn2
ζ
The above equation represents damped free vibration resulting from an initial displacement and/or an initial velocity (defined by x0 and v0 at time zero); if these values are set to zero, there is no vibration. An interactive plot of free vibration in an underdamped system can be created with the following command:
The above equation represents damped free vibration resulting from an initial displacement and/or an initial velocity (defined by x0 and v0 at time zero); if these values are set to zero, there is no vibration. An interactive plot of free vibration in an underdamped system can be created with the following command:
In[28]:=
Manipulate[Plot[xUnderDamped[t,ζ,1.0,x0,v0],{t,0,20},PlotRange{{0,20},{-1.5,1.5}}],{{ζ,.2,"Damping ratio ζ"},0,.5},{{x0,.5,"Initial displacement"},0.,1.},{{v0,.5,"Initial velocity"},0.,1.}]
Out[28]=
Forced vibration
Forced vibration
Although the solution to the EOM in E(1) consists of both a particular solution (to the forcing function) and a homogenous solution (for free vibration due to initial conditions), it can be seen from the simulation above that any amount of damping (ζ > 0) causes the vibration response from the initial conditions to eventually fade away. Since there is always some damping (energy absorption) in all systems, the examination of resonance can usually assume that only the particular solution needs to be examined. The particular solution to the EOM in E(1) is given by:
In[36]:=
xForcedResponse[ζ_,r_]=;
1
0.5
+4
2
(1-)
2
r
2
r
2
ζ
The above equation represents the magnitude of the forced vibration response resulting from the forcing function. An interactive plot of the magnitude of the forced vibration response can be created with the following command:
In[44]:=
Manipulate[Plot[xForcedResponse[ζ,r],{r,0,10},AxesLabel{r,"X/δst"},PlotRange{{0,3},{0,5}}],{{ζ,.02,"Damping ratio ζ"},0,.75}]
Out[44]=
Interpretation
Interpretation
The above interactive plot shows that the vibration response increases dramatically as r approaches 1. Since r = ω / ωn, r being equal to 1 means that the forcing frequency is approaching the natural frequency and vibration response increases dramatically.
Some of the consequence of the above interactive graph are that when ζ = 0, X/δst approaches ∞ when r approaches 1. Another important conclusion is that any amount of damping, i.e. ζ > 0 reduced the magnification for all values of r. It should also be noted that the response X/δst approaches 0 as r becomes large.
Authorship information
Les Grundman
6/23/2017
lagrundman@indianatech.edu


