Optimal Stopping
Optimal Stopping
Exploring the optimal time to act in order to maximize reward.
An Inter-planetary Diner
On your way out of Mars’ orbit, after a quick visit to your alien cousin’s fidget spinner farm, you stop at a small fast food restaurant on Phobos to purchase one of the galaxies most delicious burgers. You’ve been here many times before and know the owner, a computational burger scientist, has very strict ordering rules; when it’s time for a customer to order, they’re presented with a parade of burgers of varying quality, and must answer ‘yes’ or ‘no’ on the spot. To you, a well-trained burger classifier, a burger’s quality is immediately identifiable. However, you can only determine the quality of a burger when it’s directly in front of you, and, if you reject a burger, it’s cast into a four dimensional trash compacter, from Ikea, never to be seen again.
◼
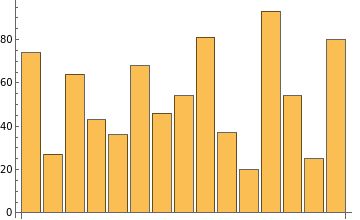
Graph a list of 1000 random integers less than 100 that represent burger quality levels:
In[68]:=
burgers=Table[RandomInteger[{1,100}],{i,1,1000},{j,1,1000}];BarChart[Take[burgers[[1]],15]]
Out[69]=
The burgers’ quality varies randomly. It’s unclear when to ideally place an order. Placing a random order proves to be a weak strategy.
◼
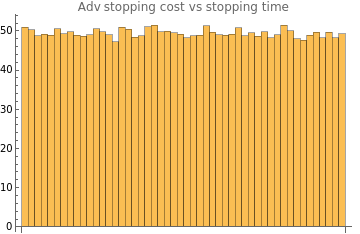
We subtract the best burger in each list from the one we choose randomly:
In[70]:=
proximity=Table[Max[burgers[[i]]]-burgers[[i]][[t]],{t,1,1000},{i,1,1000}];
In[73]:=
BarChart[Take[Map[Total[#]/Length[#]&,proximity],50],PlotLabel"Adv stopping cost vs stopping time"]
Out[73]=
The Theoretical Ideal Stopping Time
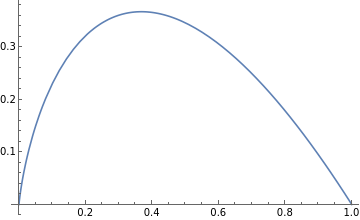
We obtain an equation which models the probability density function for the probability of selecting the ideal burger from the menu at each point in the menu.
◼
For an arbitrary cutoff point, this equation models the probability of selecting the best burger:
In[5]:=
f[x_]:=-x*Log[x]Plot[f[x],{x,0,1}]
Out[6]=
There is clearly a global maximum present in the probability density function.
◼
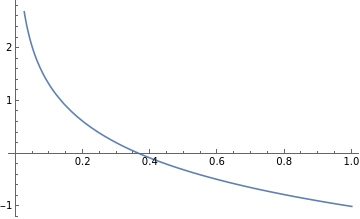
Taking the derivative of the above equation, we obtain the following:
In[7]:=
Plot[f'[x],{x,0,1}]
Out[7]=
◼
We discover that the optimal place to make our choice occurs at :
1
In[8]:=
Solve[0f'[x],x]
Out[8]=
x
1
Verifying Theory with Experimentation
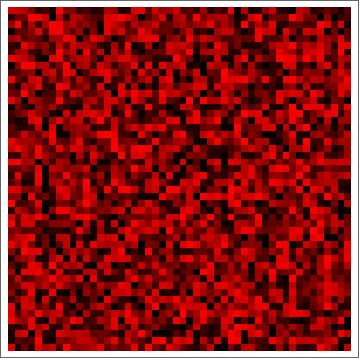
I forgot to mention: you’re a vampire who enjoys bright red hamburgers above all others and hates burnt meat. While waiting in line, you pull out the card upon which you record all your visits to the restaurant. Every row of the card is a separate visit to the restaurant and every cell is a burger condition.
◼
A 50 by 50 array plot. Each cell is a shade of red representing burger quality:
In[191]:=
exp=Table[RandomInteger[{1,100}],{i,1,1000},{j,1,1000}];ArrayPlot[Table[RGBColor[exp[[t]][[i]]/100,0,0],{i,1,50},{t,1,50}]]
Out[192]=
◼
We define a function to choose the next better burger than the one’s we’ve seen so far:
In[48]:=
next[val_,lst_]:=With[{x=Select[lst,#>=val&]},If[Length[x]>0,x[[1]],lst[[-1]]]]
◼
Find the next better burger than in the given list:
In[189]:=
RGBColornext[[1]],#[[1]]&/@,,,,,,,,,,,,0,0
Out[49]=
Using the function above, we can select different burgers and measure how close we come to selecting the ideal burger from a given menu.
◼
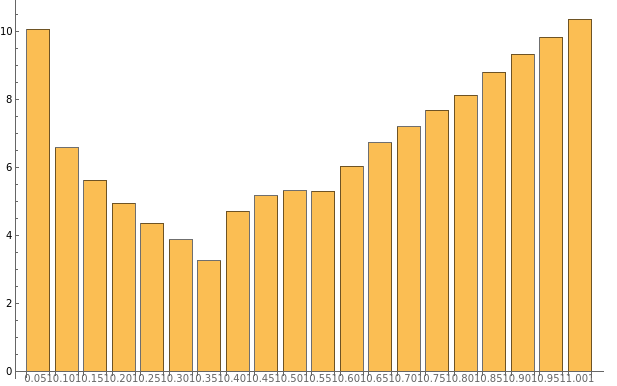
On average, the minimum distance between our choice and the ideal burger occurs around thirty-seven percent or 1/e:
In[65]:=
BarChart[Log/@(Map[tMapIndexed[{d,i}With[{n=1+(First[i]-1)*50},Subtract[Max[t],next[Max[t[[1;;n]]],t[[n+1;;-1]]]]],t[[1;;1000;;50]]],exp]//Transpose//Map[rTotal[r],#]&),ChartLabelsRange[0.051,1.001,0.05]]
Out[65]=
Needless to say, when you get to the front of the line, you choose a great burger from the menu, and the other customers look on in envy.
Further Explorations
Optimal stopping Theory
The Secretary Problem
Bellman equations
The odds-algorithm
Authorship information
Richard Hayes
22 June 17
rhaye016@uottawa.ca
Resources