WOLFRAM NOTEBOOK

Insert
Sample

1-D Conductión across a Tube “Finite Difference Equation”

In this notebook we are going to resolve the temperature distribution on a pipeline.
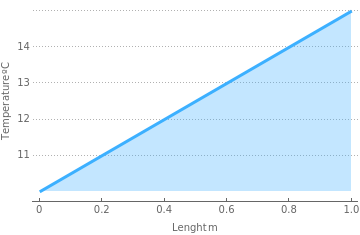
At the north boundary we have a constant flow heat, At the south boundary it is a fluid; whose thermal field is a lineal distribution. The west boundary is adiabatic and finally we have a known temperature at the east.

Data And Control Parameters

The initial conditions, the geometric data and the physics properties of the material (pipeline) and the fluid are here (coefficient of convection, conduction, ambient temperature, temperature distribution of the fluid, specific heat).

You can control al the different parameters; and the temperature distribution over the cupper is going to change. Also you can change the dimensions of the pipeline; Length, Thick (external ”N” and internal diameter “S”).

Also the most interesting parameter to change is the number of nodes, so you can visualize with more precision the temperature distribution in the pipeline.

In[54]:=
qW=0;(*Adiabatic West boundary Units: W*)tempE=25;(*Temperature East boundary Units ºC--YOU CAN CHANGE*)qN=1000;(*Heat North boundary
W
2
m
--YOU CAN CHANGE*)a=5;(*Constant linear fluid distribution "Slope"--YOU CAN CHANGE*)b=10;(*Constant linear fluid distribution "y-axis intercept"--YOU CAN CHANGE*)αS=100;(*Convection coeficient Units:
W
2
m
ºC
*)diamS=0.007; (*Diameter first boundary Units:
2
m
--YOU CAN CHANGE*)areaS=
Pi
2
diamS
4
;(*Area first boundary Units: m*)perS=Pi diamS;(*Perimeter Units: m*)diamN=0.01;(*Diameter second boundary Units:--YOU CAN CHANGE m*)areaN=
Pi
2
diamN
4
;(*Area second boundary Units:
2
m
*)perN=Pi diamN;(*Perimeter Units: m*)areaEffect=areaN-areaS;L=1;(*Pipeline Lenght Units: m--YOU CAN CHANGE*) λp=400;(*Pipeline Conductivity
W
m ºC
*) Cpt=400;(*Fluid Specific Heat
J
kg ºC
*) nodes=200;(*--CHANGE EVERY TIME YOU COMPILE THE WHOLE PROGRAM TO SEE MORE NODES OR LESS*)distNodes=
L
nodes-1
;(*Distance between nodes*)

Fluid thermic Field

The initial conditions, the geometric data and the coefficient of convection are here.
Direction/Caption: In a single line, say what the code that follows will do. End this line with a colon (e.g. “Make a map of Portugal:”)
In[17]:=
Ts[z_]:=a z+bPlot[Ts[z],{z,0,L},FillingAxis,PlotTheme->"Business",PlotStyle96,FrameLabel{"Lenght m","Temperature ºC"}]Table[Ts[z],{z,0,L,distNodes}]//N;
Out[18]=
From here you are going to resolve a problem of energy transmisión around the pipeline. This happened because there are a temperature difference between the pipeline, the fluid, the surroundings and the heat transmission form North part of the pipeline.

The mechanism of heat transmission we are modeling is 1-D heat conduction, and we are going to use a numeric method for resolve it and the way we are going to discretize the governing equations is called FDE (“finite difference equations”).

Nodes Discretization

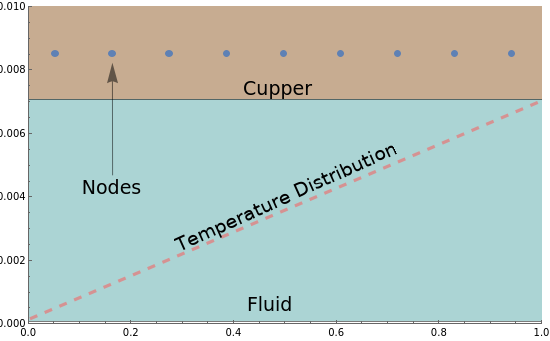
In this par we are just putting on the right position each node so we can discretize the FDE based on energy balance over the pipeline
In[20]:=
distNodes=
L
nodes-1
;(*Distance between nodes*)volx=Range[0,L,distNodes];posx= Table
volx[[i]]+volx[[i+1]]
2
,{i,1,nodes-1};posy=Table
diamN+diamS
2
,nodes-1;pos=Flatten[Table[{posx[[i]],posy[[i]]},{i,1,nodes-1}],0];(*position x,y of nodes*)ListPlot[pos, PlotRange{{0,1},{0,diamN}}]
Out[25]=
0.0
0.2
0.4
0.6
0.8
1.0
0.000
0.002
0.004
0.006
0.008
0.010
In[324]:=

Characteristic Nodes and Control Volumes

The first square show the Area of conduction and the Perimeters where heat conductive transfer occurs. The second square shows the properties of the balance of energy with de node of interest (p) with the boundary north and south (d); and the nodes west (c) and east (b).

Numerical Procedure

Realizing a energy balance over each characteristic node we obtain the results of the abcd coefficients .

Forming TDMA “Tridiagonal Matrix”

Resolving TDMA for P and Q

Temperatures Distribution

With Qtot and Ptot we can calculate the distribution of temperature for the first iteration...The program is not complete...
The firs values of this list is the temperature of the last node, and the last value is the temperature from the first node.
This process don’t need to be iterative because the physical properties don’t depend of the initial temperature. Otherwise we need to propose an initial distribution a temperatures and refresh it with the calculate ones.
Finally you can evaluate this notebook changing the number of nodes, to whatever value you deserve (not less than 3).

This method could apply to 1-D, 2-D and 3-D heat transfer systems.
This is a example of a 2-D heat dissipator who resolve it with the same method using 6 characteristic methods.
Further Explorations
TDMA
Gauss-Sieddel Iteration
Heat Transfer on a pipeline
Authorship information
Rubén García Soriano
21/06/2017
rugas@ier.unam.mx
Wolfram Cloud

You are using a browser not supported by the Wolfram Cloud

Supported browsers include recent versions of Chrome, Edge, Firefox and Safari.


I understand and wish to continue anyway »

You are using a browser not supported by the Wolfram Cloud. Supported browsers include recent versions of Chrome, Edge, Firefox and Safari.