3D version of the built-in VoronoiDiagram
3D version of the built-in VoronoiDiagram
Author: Chip Hurst
Here I will show how to create 3D version of VoronoiDiagram in Wolfram Language.
Note that there’s currently no way to represent a collection of 3D Voronoi mesh cells in a MeshRegion or BoundaryMeshRegion.
Here’s a routine that takes the dual of the DelaunayMesh and returns an Association where the keys are the points and the values are their respective Voronoi cells.
Note that there’s currently no way to represent a collection of 3D Voronoi mesh cells in a MeshRegion or BoundaryMeshRegion.
Here’s a routine that takes the dual of the DelaunayMesh and returns an Association where the keys are the points and the values are their respective Voronoi cells.
pad[δ_][{min_,max_}]:={min,max}+δ(max-min){-1,1}VoronoiCells[pts_]/;MatrixQ[pts,NumericQ]&&2≤Last[Dimensions[pts]]≤3:=Block[{bds,dm,conn,adj,lc,pc,cpts,hpts,hns,hp,vcells},bds=pad[.1]/@MinMax/@Transpose[pts];dm=DelaunayMesh[pts];conn=dm["ConnectivityMatrix"[0,1]];adj=conn.Transpose[conn];lc=conn["MatrixColumns"];pc=adj["MatrixColumns"];cpts=MeshCoordinates[dm];vcells=Table[hpts=PropertyValue[{dm,{1,lc[[i]]}},MeshCellCentroid];hns=Transpose[Transpose[cpts[[DeleteCases[pc[[i]],i]]]]-cpts[[i]]];hp=MapThread[HalfSpace,{hns,hpts}];BoundaryDiscretizeGraphics[#,PlotRangebds]&/@hp,{i,MeshCellCount[dm,0]}];AssociationThread[cpts,RegionIntersection@@@vcells]]
Example:
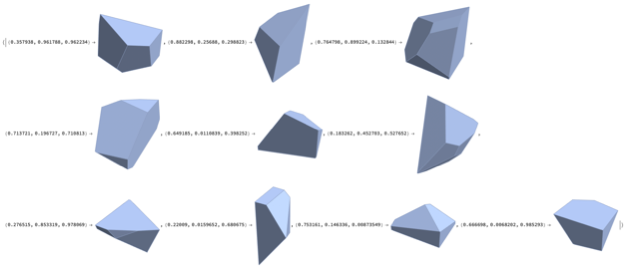
SeedRandom[10000];pts=RandomReal[1,{10,3}];vc=VoronoiCells[pts]
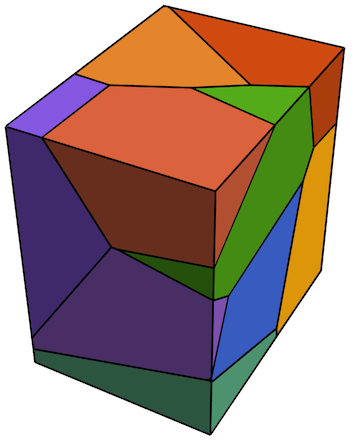
Show[MapIndexed[BoundaryMeshRegion[#,MeshCellStyle{1{Black,Thick},2{ColorData[112][First[#2]]}}]&,Values[vc]]]
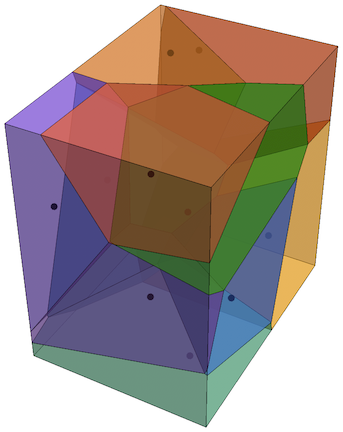
Show[MapIndexed[BoundaryMeshRegion[#,MeshCellStyle{1Black,2{Opacity[0.5],ColorData[112][First[#2]]}}]&,Values[vc]],Graphics3D[{PointSize[Large],Point[pts]}],Method{"RelieveDPZFighting"True}]
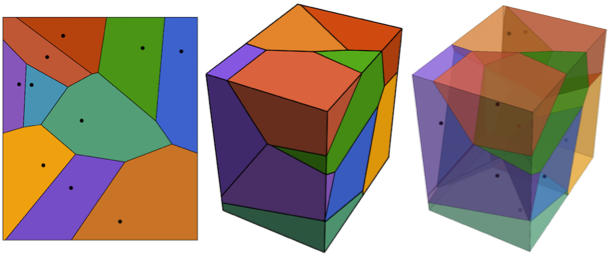
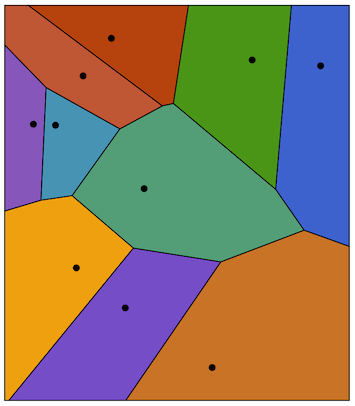
Note that this works in 2D too:
SeedRandom[10000];pts=RandomReal[1,{10,2}];vc=VoronoiCells[pts];Show[MapIndexed[BoundaryMeshRegion[#,MeshCellStyle{1{Black,Thick},2{ColorData[112][First[#2]]}}]&,Values[vc]],Epilog{PointSize[Large],Point[pts]}]
