GroupTheory`
GroupTheory`
GTTbSymmetryBands
GTTbSymmetryBandStructure[bands, wave, min, max, group, recipbasis, basis] performs a symmetry analysis for an entire band structure. The bands in file bands and the wavefunctions in wave. Bands are analyzed for band numbers [min,max]. group is the point group of the system with reciprocal basis recipbasis. Basis defines the basis of the crystal.
Details and Options
- The output of the band structure was changed. It contains now also the symmetry points. Thus, klist was removed from the parameter list.
- The following options can be given:
-
GOVerbose False Controls output of additional information GOIrepNotation "Bouckaert" Notation of irreducible representation PlotStyle {{Thin,Black}} representation of bands in graph Joined True standard option of ListPlot PlotRange All standard option of ListPlot GOLabelShift {0.05, 0.02} a global label shift can be applied to all labels GOLabelStyle {} the style of the labels can be changed GOPlot True decides if a plot of the bands ins presented FrameLabel {"" ,"Energy (eV)"} standard option of ListPlot PlotLabel "Band structure" standard option of ListPlot GOSpinOrbit False decides if spin-orbit coupling is included GOOrbitalConstruction True non-standard orbital construction GOPrecision 4 sets the precision of eigenvalues. - W. Hergert, M. Geilhufe, Group Theory in Solid State Physics and Photonics. Problem Solving with Mathematica, chapter 9.6
Examples
open allclose allBasic Examples (1)
Give structural information and define the point group.
Read the fcc Hamiltonian with spd-basis
Prepare Hamiltonian for calculation
Prepare a band structure plot to check if all is correct.
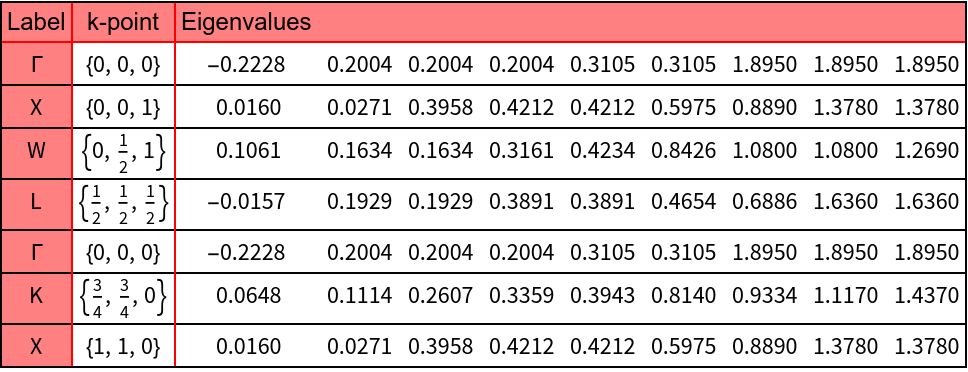
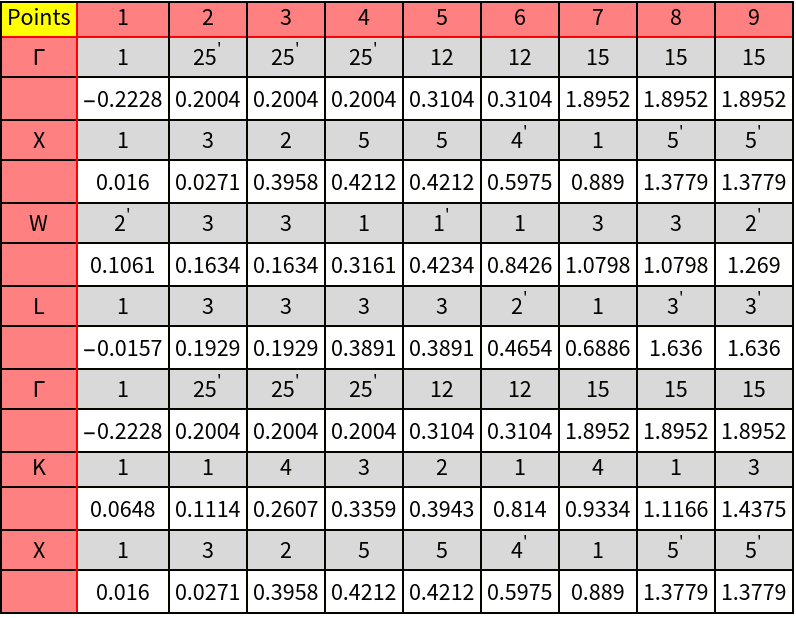
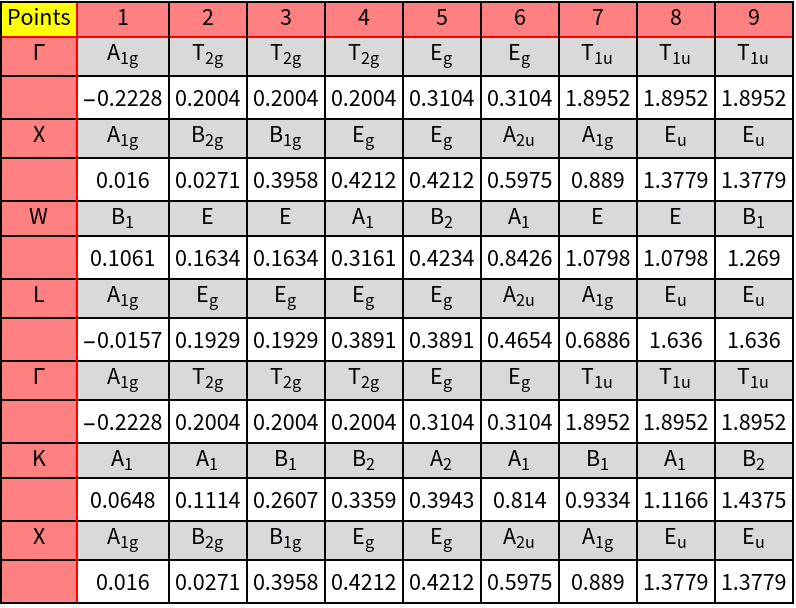
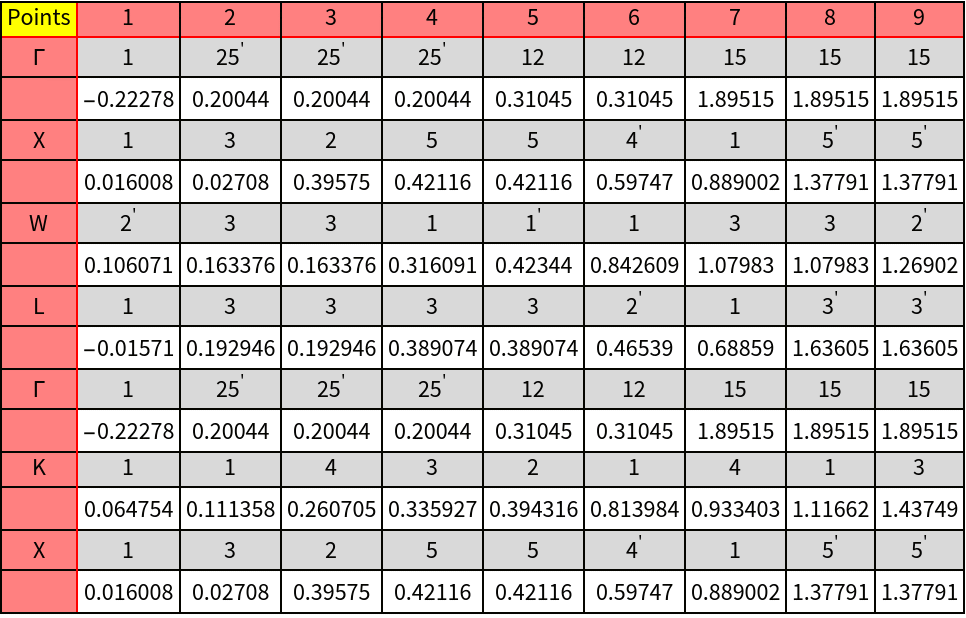
bands contains the band structure and as a second part the list of symmetry point (former klist in parameter list)

The position of the levels can be improved by interactive drawing tools or by means of GTBandsPlotImprove.
Options (9)
FrameLabel, PlotLabel, PlotStyle, PlotRange, and Joined are standard option of ListPlot and will be not explained here.